

HOW IS THE REAL ESTATE MARKET THESE DAYS?
If there was a word to sum up the first 3 months of the Niagara real estate market in 2024, it would be pensive. Considering the roller coaster ride we’ve all been on over the last several years, a reserved approach is highly understandable. After all, the Niagara real estate market set record highs (2021) and record lows (2023) in the space of a few years. So, here in early 2024, the marketplace seems to be anticipating a bit more stability as we move through the year.
This report has a look at various aspects of the Niagara real estate market. One thing to note is that the Niagara Region is made up of several municipalities, some large and some small. The smaller markets (Pelham, Lincoln, Niagara-on-the-Lake) can be more challenging to analyze due to smaller monthly sales volume, so this report is meant to be a guide. If you are looking for a deeper dive into a particular town or neighbourhood, let’s chat!
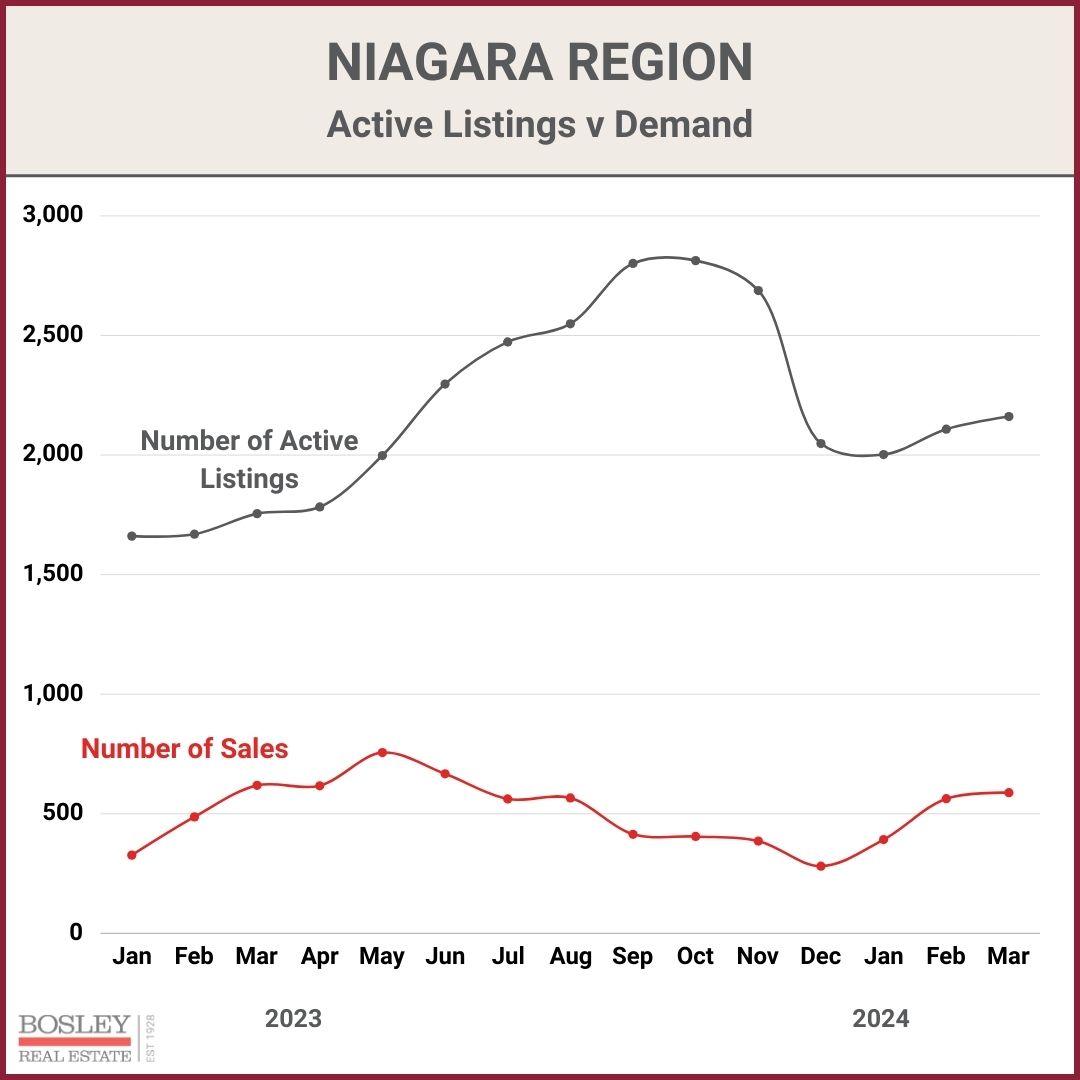
This graph shows the supply (grey line) compared to monthly sales (red line) going back to January 2023. Spring 2023 was off to a strong start until the Bank of Canada arrived with two 0.25% rate increases. From there, you can clearly see how the supply of available inventory built up while sales pulled back.
While monthly active listings are still at elevated rates, we’ve seen monthly sales so far in 2024 begin to move in the right direction.
HOW ABOUT MY CITY?
Niagara has several cities with small monthly sales volume (15 - 20 per month) that are made up of many unique parts. The result is wild monthly volatility. This report will mainly focus on the large scale data but if you’re curious about your particular area, reach out and we’ll help.
St.Catharines has historically been the highest producer of monthly sales in the Niagara Region. You will see that the strong start of 2023 was even more pronounced while the gap between inventory and demand grew even wider yet as we moved through last year.
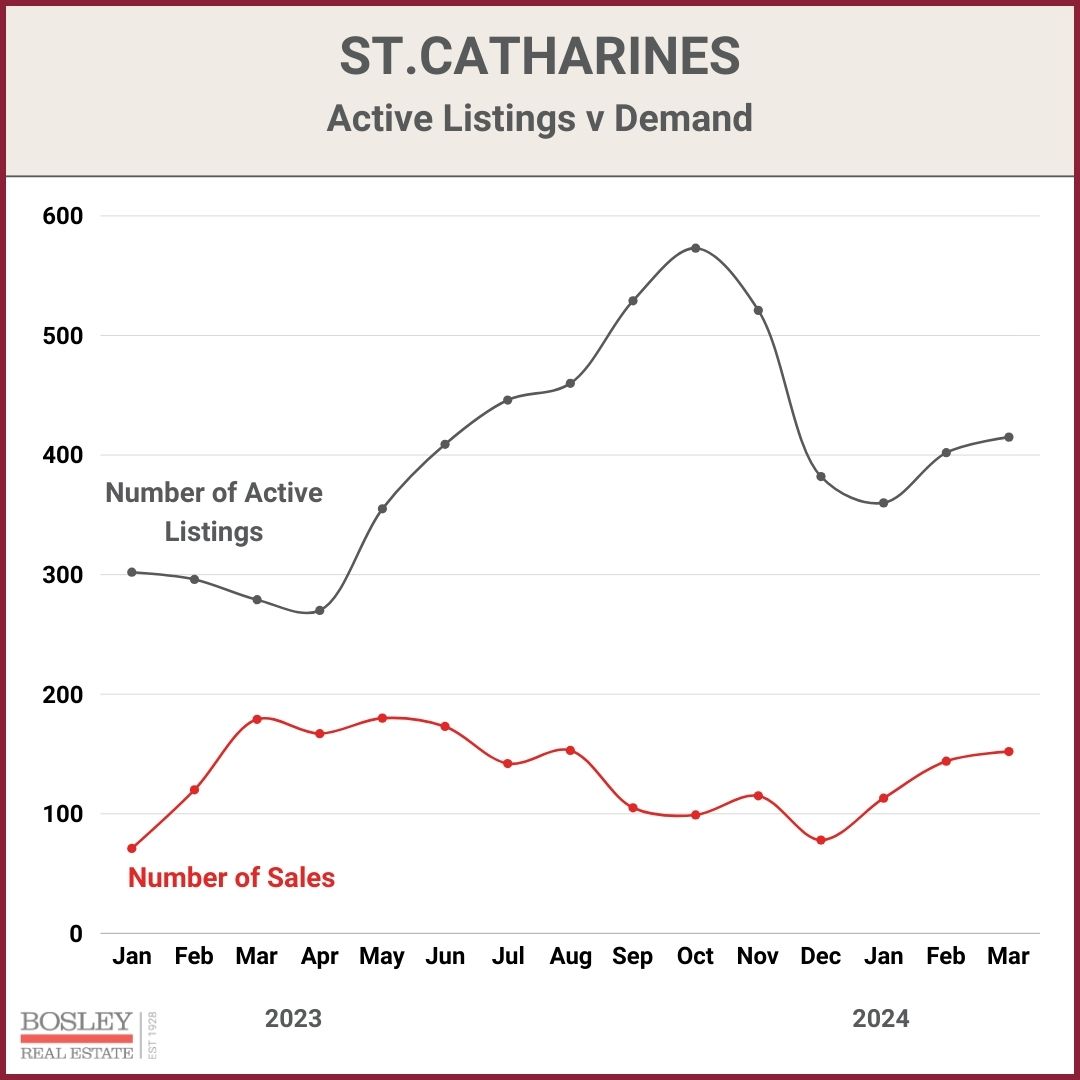
Here in early 2024, inventory remains at record highs while sales continue to stage a modest comeback.
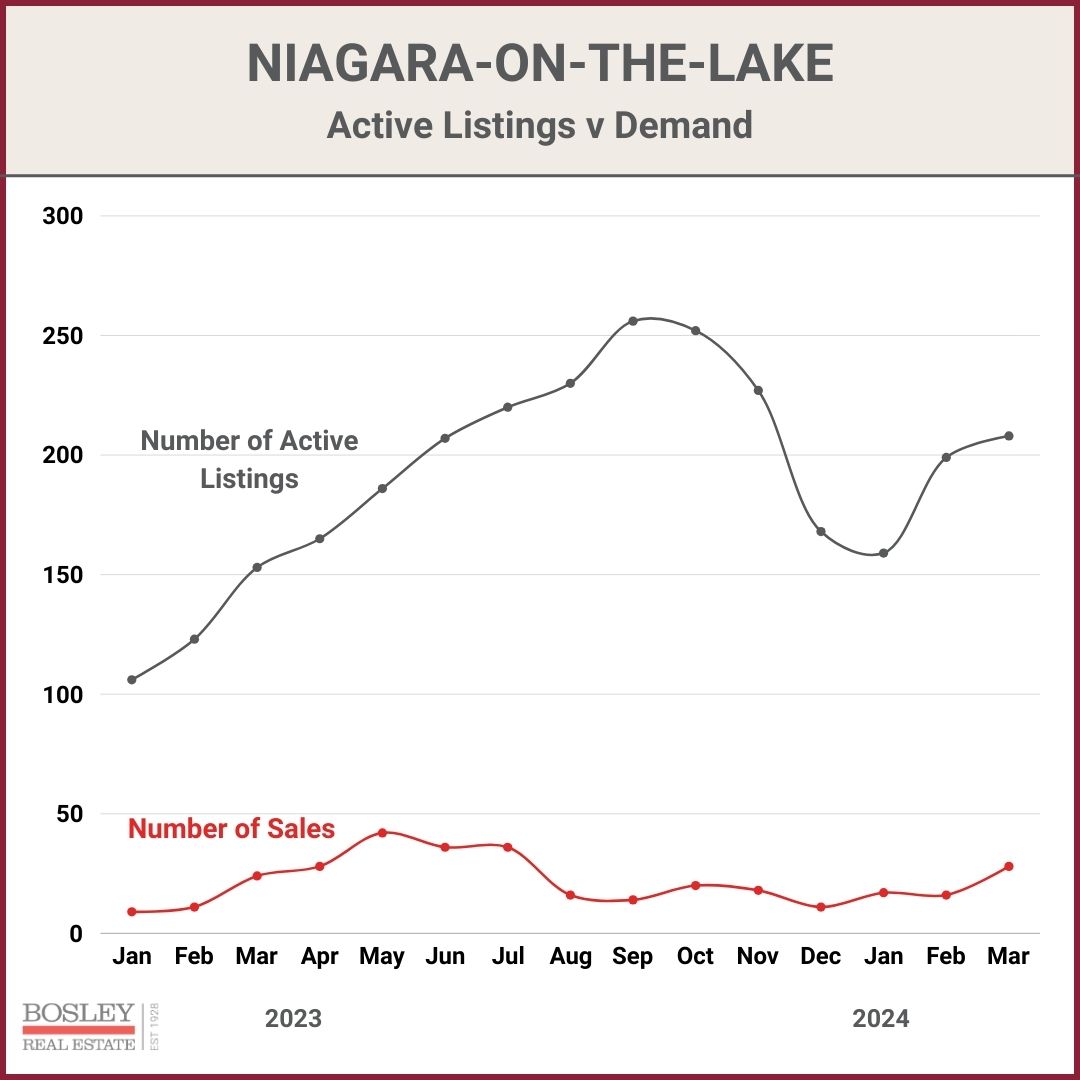
Small markets with a widespread geographical footprint like NOTL create a challenge when summarizing the market in general. That said, you can clearly see a market that has had no shortage of inventory while sales struggled, With 265 sales in 2023, Q1 2024 has shown modest improvement with March producing a respectable 208 sales, the highest for the month since March 2021 (an all-time record year).
WHAT IS NORMAL?
One way to make sense of volatility is to compare a segment of the market to ‘what is normal?’ In this case, we are comparing monthly sales to the 10-year average for the region.
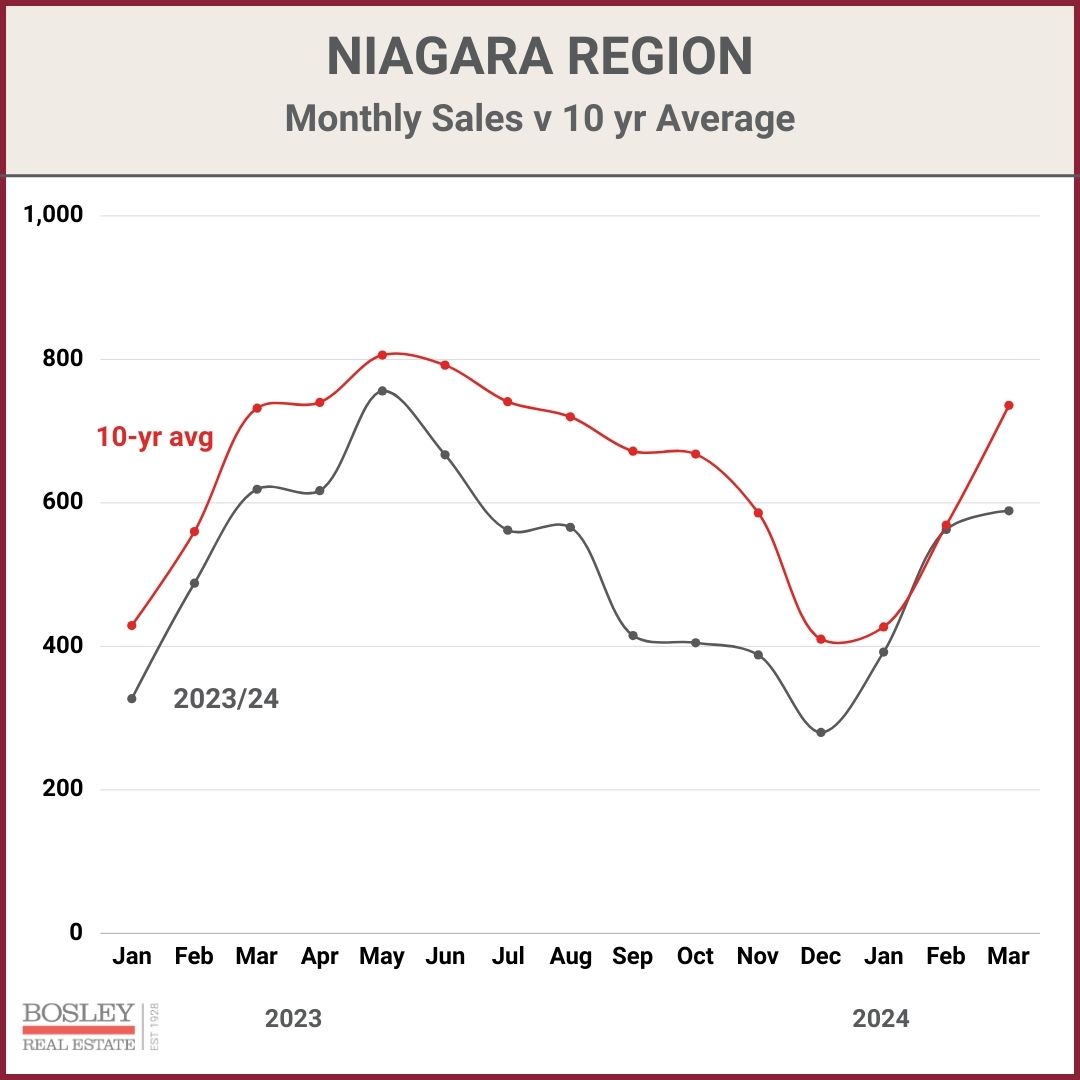
There are several notable aspects to this chart. Early 2023 was clearly showing signs of a resilient marketplace as the market adjusted to the elevated interest rates. The Bank of Canada rate increases of June & July drove sales down to 20 - 40% below the 10-year average for the last half of 2023.
A reason for optimism is the push towards normal here in Q1 2024 with February landing within 1% of the 10-year average. That is the strongest performance since spring 2022.
HOW ABOUT PRICES?
Depending on the market conditions, monthly demand and prices trends can vary widely between price segments.. The following few sections have a look at home price trends in Q1.
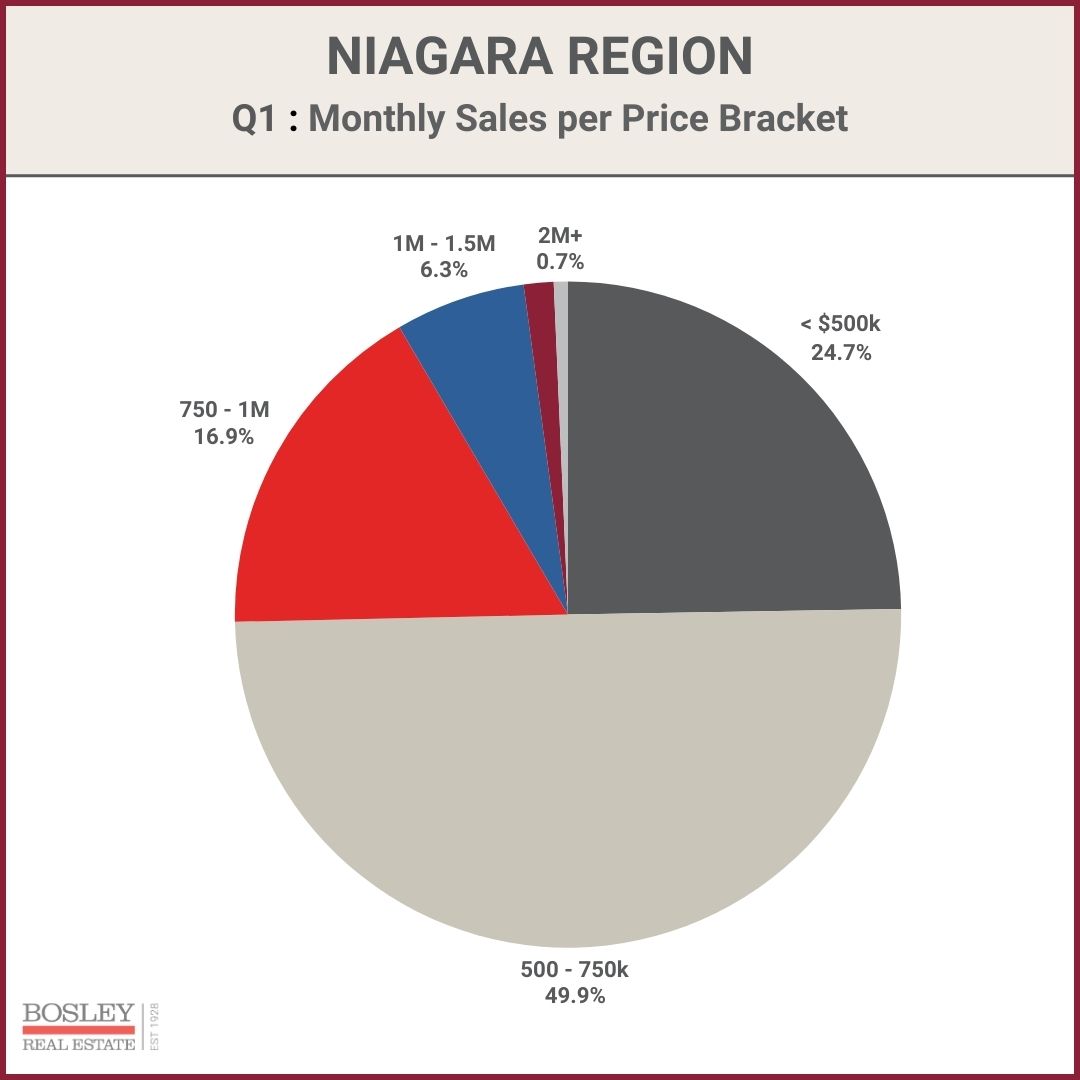
This chart pretty clearly shows the market’s appetite for the various price segments across Niagara. While February was much stronger in sales, the number one price segment was $500 - 600,000. While March took a slight step back in sales volume, the busiest price segment moved up to $600 - 700,000. This cart shows Q1 where 50% of all sales were $500 - 750,000. Meanwhile, 50% are ALL listings in Niagara are priced higher than $750,000.
FOOD FOR THOUGHT...
While often the most attention grabbing, macro average sale prices are full of nuance. We often chat with clients who see a national or large scale report or headline that excitedly pronounces that home prices are up or down by x%. Our recommendation? Use that info as a (very) rough guideline. There is no one all- encompassing real estate market. Your home in your neighbourhood in your area of your city may be on a different trajectory than a macro-economic report. This is where a skilled and insightful Realtor brings true value to you.
WITH THAT SAID...
This chart has a look at the average sale price trends over Q4 2023 and Q1 2024. In particular, we are looking at the Niagara Region as well as the three largest cities in terms of volume. They are, in order, St.Catharines, Niagara Falls and Welland.
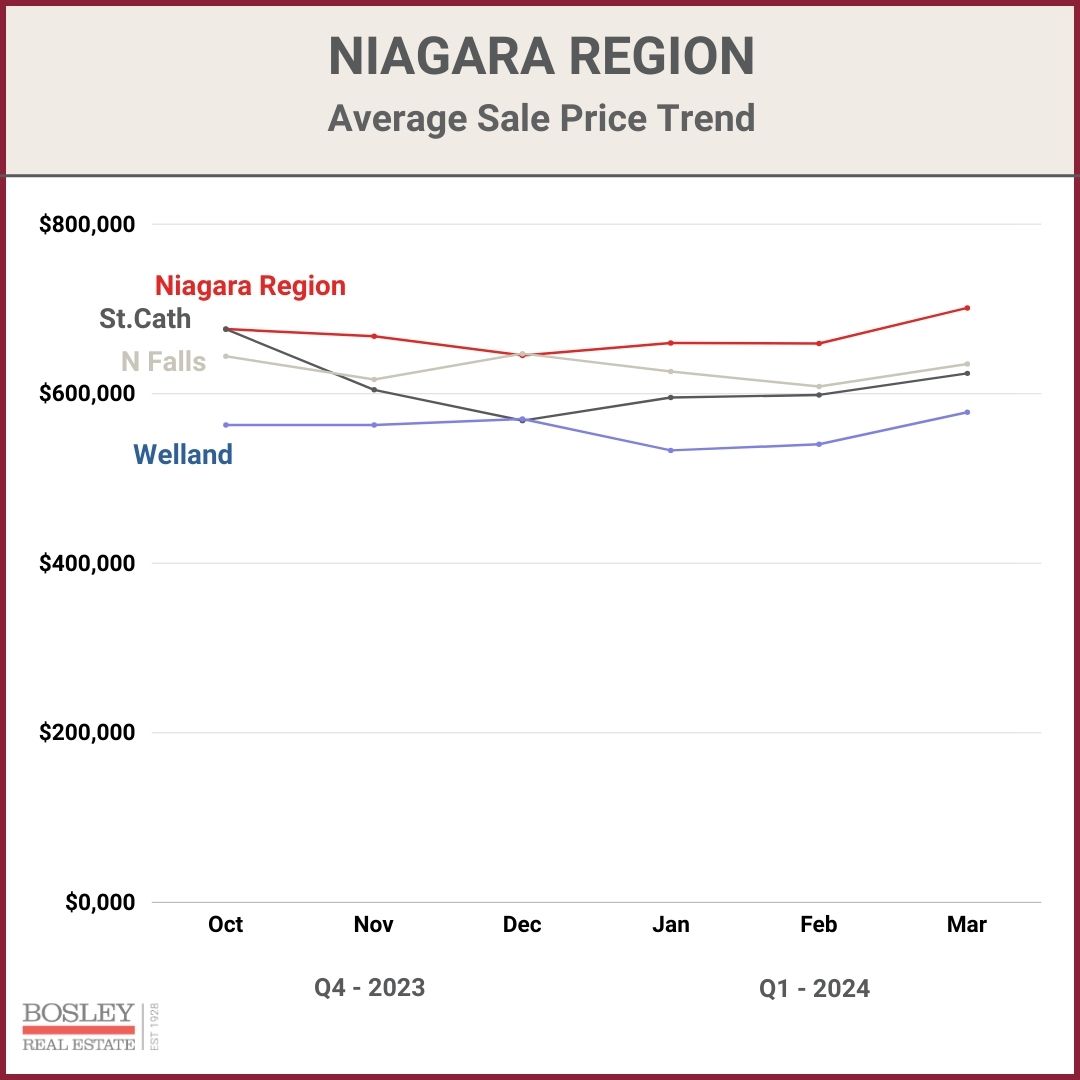
There are a few generalities we can apply to the Niagara Region in terms of home prices. First, as this graph shows, many municipalities saw what appears to be the trough, happen towards the end of 2023. Q1 2024, similar to Q1 2023, has seen prices build up some steam which is a combination of increased confidence mixed with the median price increasing. Or in other words, the upper end of the price range is starting to awaken, which is pulling the average up with it.
PRICING DATA TYPES
While average sale prices tend to get the most attention, median sale prices along with the HPI benchmark price are also useful tools in keeping track of trends. For example, St.Catharines had 3 sales over $2 million in October 2023 (8 in the entire year), resulting in a wide variance between average, median and benchmark prices. More investigation is typically required when it comes to home prices.
A QUICK LOOK...
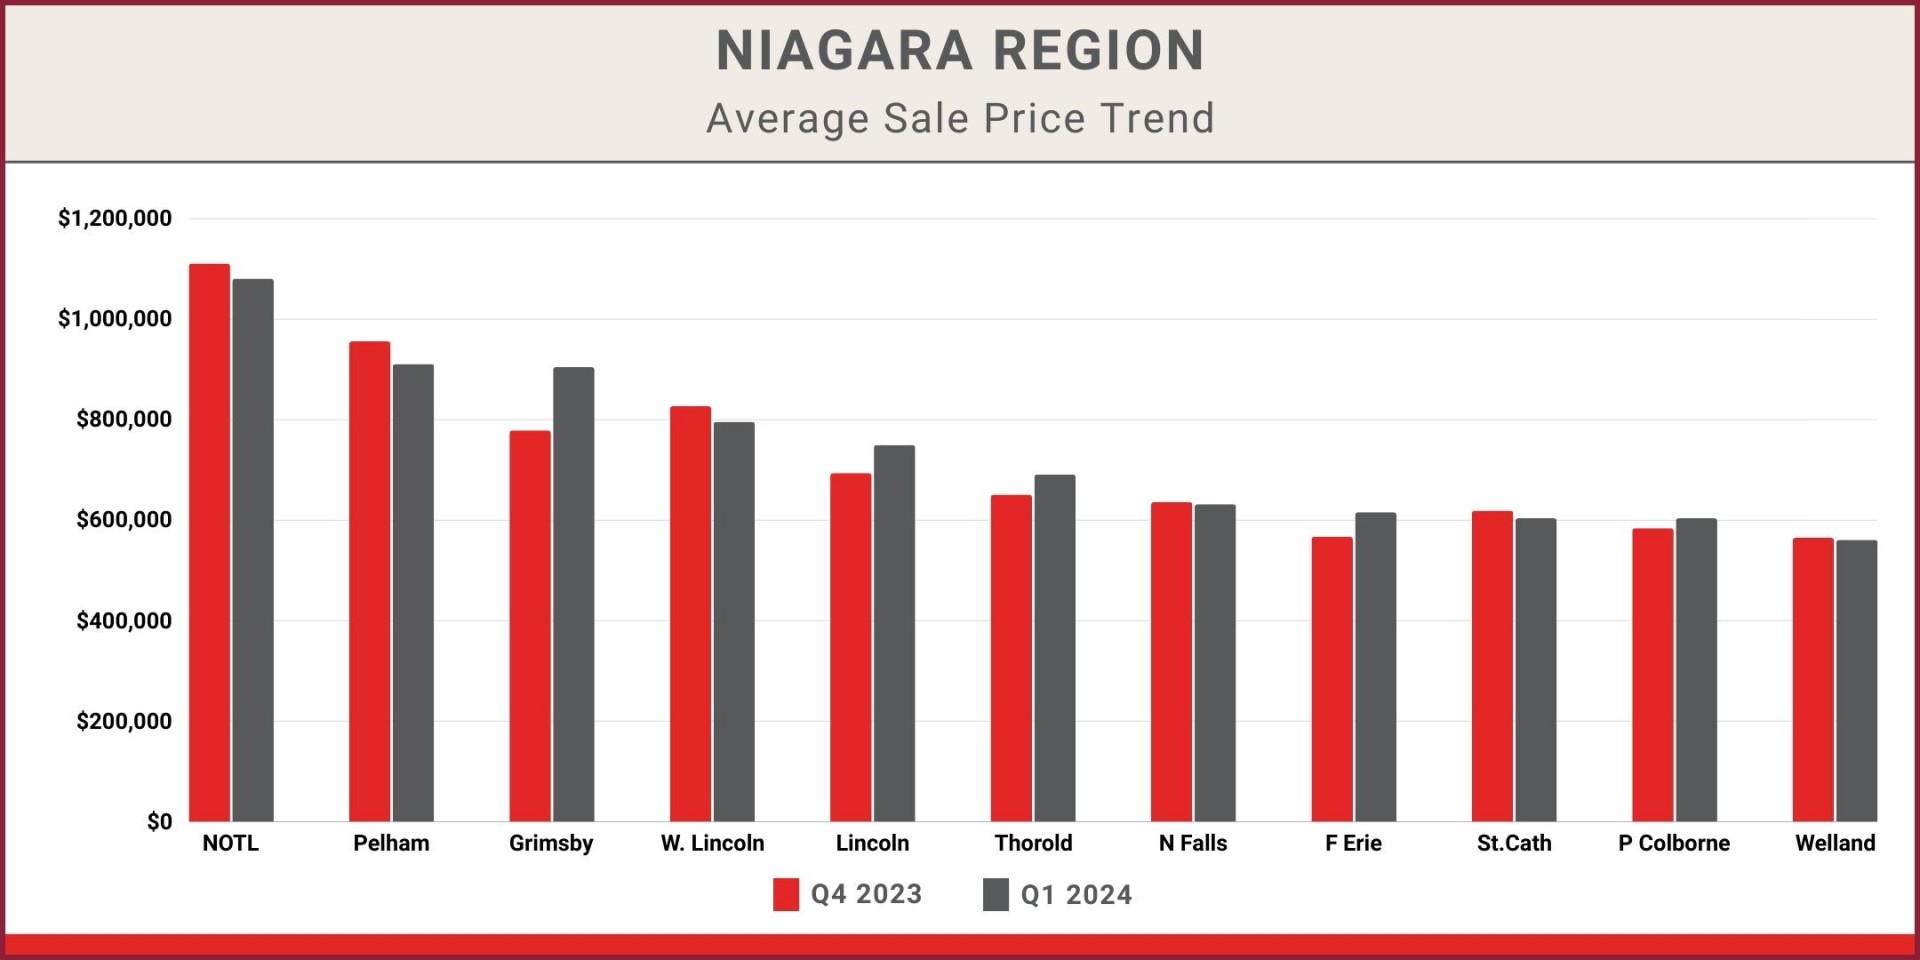
This chart is a quick look at average sale prices for Q4 2023 and Q1 2024 in all municipalities in the Niagara Region. Again, the same two caveats to consider. 1. small market cities equal big data volatility and 2. outlier sales are impacting even larger markets like St.Catharines.
6TH PLACE FINISH!
While prices continue to find stability after a rocky 2023, Q1 2024 is setting up for a middle of the road finish when looking at the previous decade. Coming in at 1,550 sales, that places Q1 in a solid 6th place finish when compared to Q1 going back to 2015. Not exactly a lights out performance, but with 100 more sales than Q1 2023, we’ll take it as a sign of improvement.
HOW LONG WILL IT TAKE TO SELL MY HOME?
It depends. How are the market conditions related to the type of home your selling? How does your asking price align with the competition? Those are two of many questions to ask when anticipating time on the market. In the chart below, you’ll see a few lines. Without getting too heavy into the details, CDOM accounts for cumulative days on market for when a property is off the market and brought back on within a certain time. Meanwhile, DOM only looks at one particular listing on the market. As a result, you can clearly see that CDOM (true days on market) is running approximately one month longer than DOM.
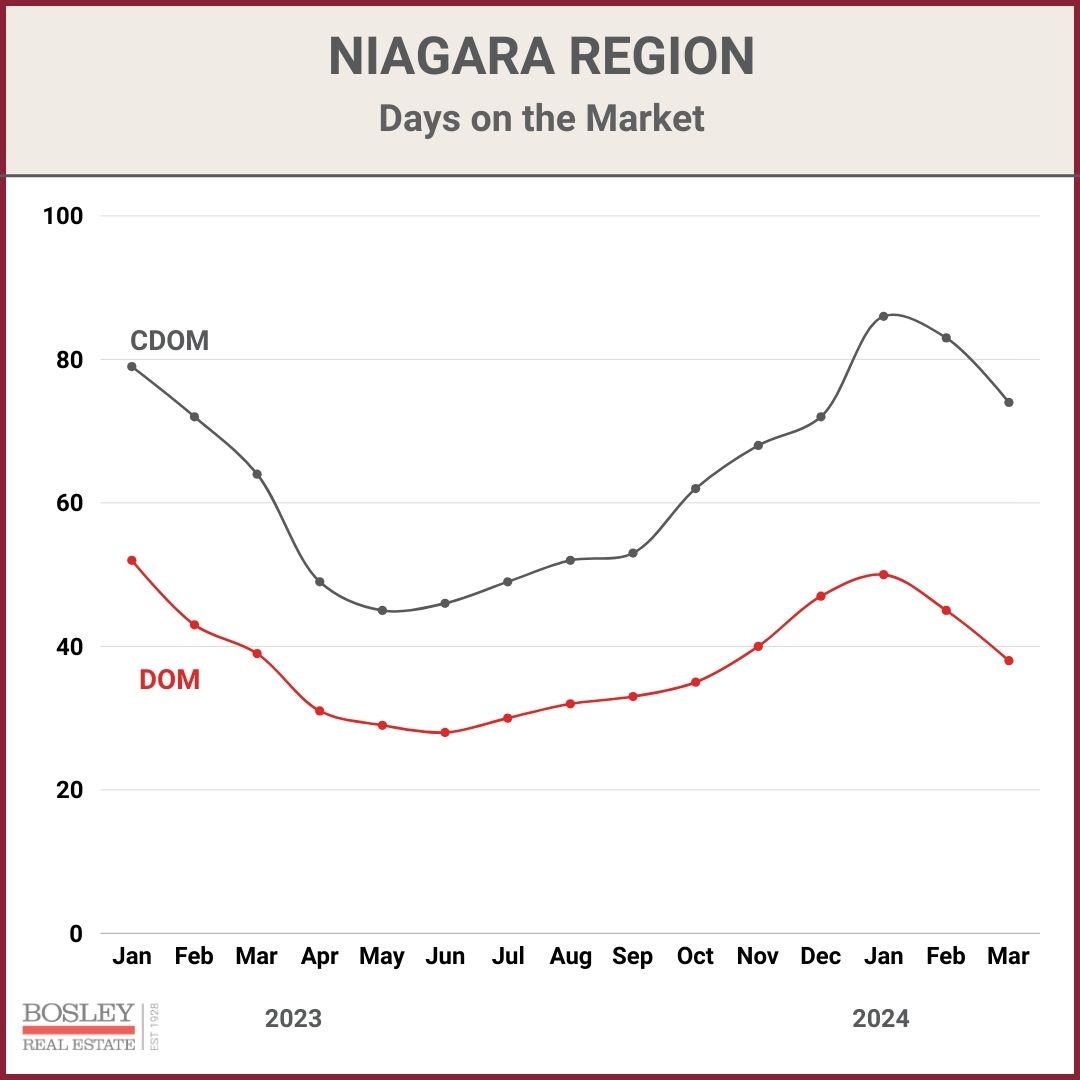
That being said, the numbers overall show a market that is slower than normal. In general, Niagara is running at the highest days on the market since 2015, with some areas at record highs. The good news here in 2024 is that Q1 showed a steady improvement in both DOM and CDOM. As stability and market sentiment improves, we expect to see a continued decreased in time on the market. Great news for you sellers!
WHAT TO WATCH?
We expect to see the days on market trend follow a similar pattern to last year. That would bring overall CDOM into the mid 40s range, down from 80-85 days in early 2024.
WHAT HAPPENS NEXT?
All eyes continue to be on the Bank of Canada and the impact of any future interest rate changes. For the spring market, we expect to see a market that continues to make slow progress towards normal levels. Heightened inventory along with hesitant demand will continue to dictate pricing, at least for the time being. If you are ever interested in chatting further about the market, your home or real estate in general, we are here and happy to help.