These trends are confusing...
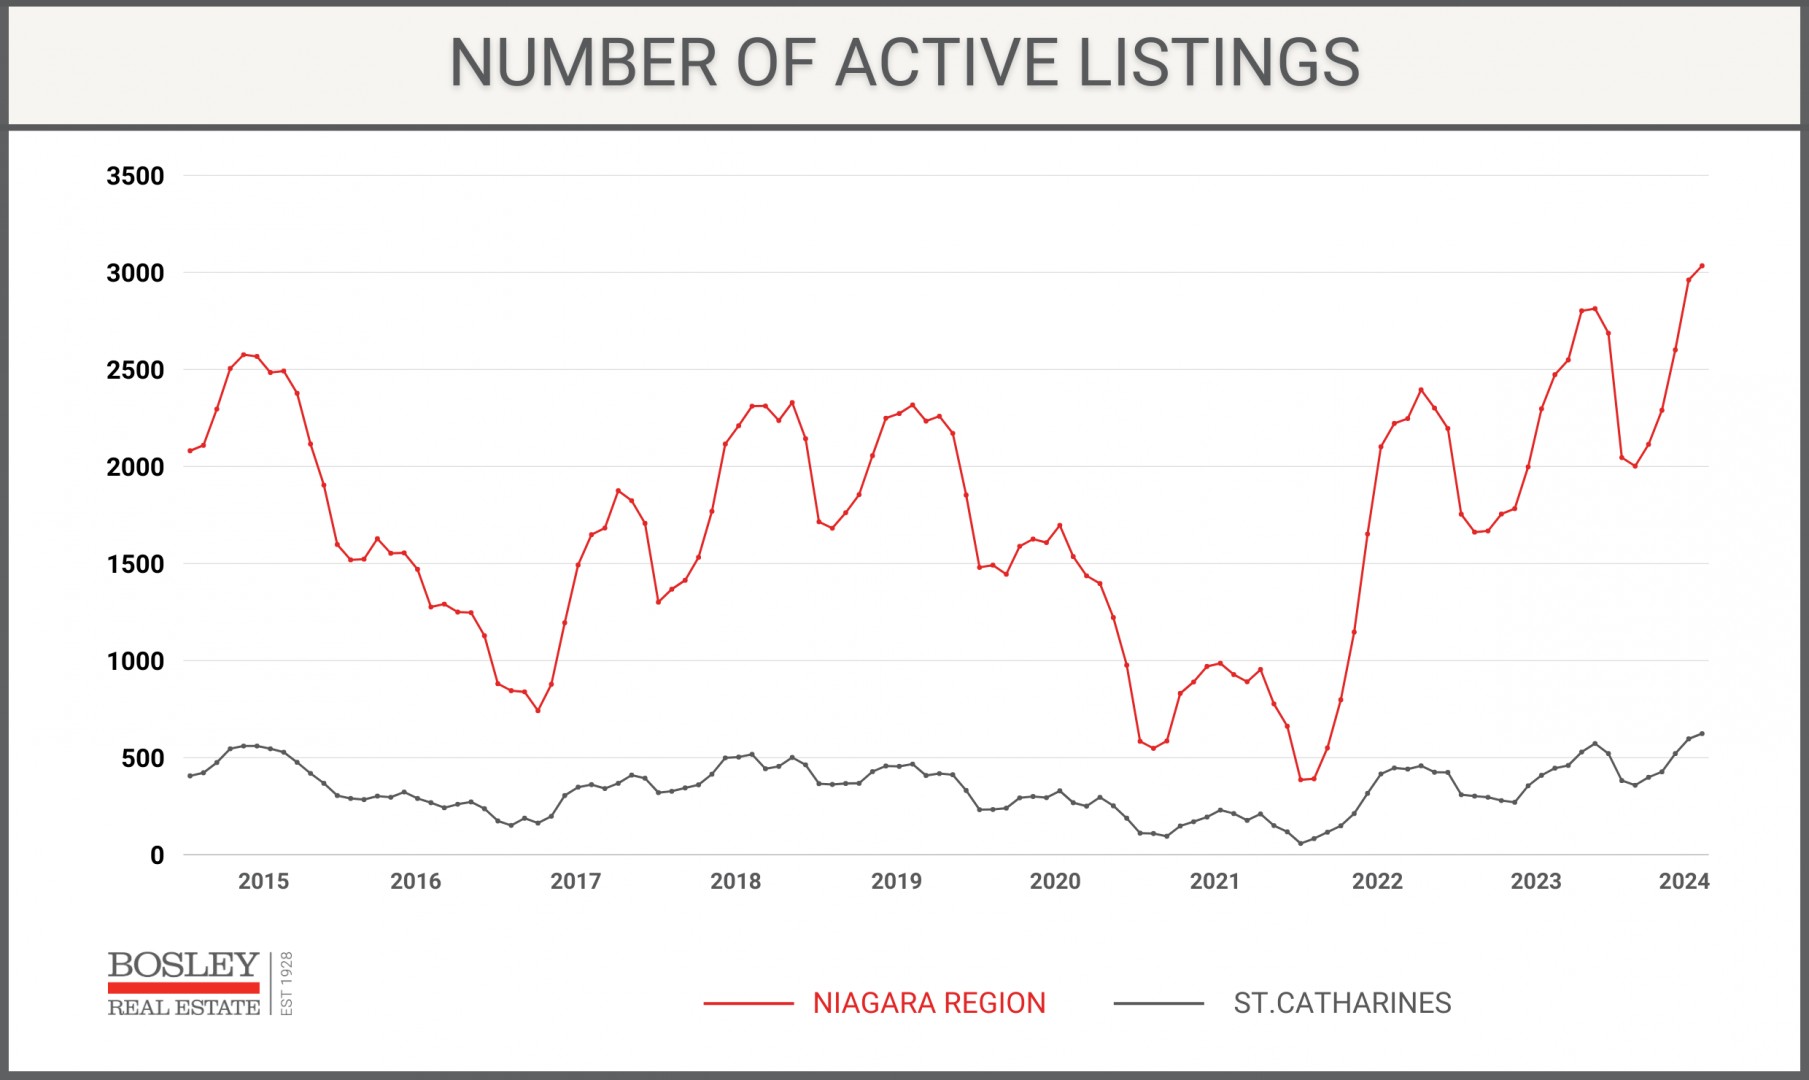
3,000 is a significant number when it comes to Niagara real estate here in 2024. For the first time in modern days, there are currently more than 3,000 active listings in Niagara here in Niagara.
Why is that significant?
Active listings in a month are a quick and insightful look at the state of the current market. More (or less) active inventory is a direct reflection of market sentiment.
Days on the market will determine how happy or frustrated a seller is. They will also determine how stressed or comfortable a buyer is.
Levels of inventory will determine your competition as a seller as well as a buyer. Is there fear of loss? Is there fear of not being able to sell this to buy that? And if you have felt this roller coaster of the past few years, you’re not alone. Our market has more resembled the Levianthan at Canada’s Wonderland than a normal, (even moderately) predictable real estate market.
Look no further than the difference in the month of June over the last several years.
While June 2024 currently has 3,055 active listings, three years ago in the mayhem of 2021, June of that year only had 986 active listings. Each month and each market come with its own characteristics, and this June is a 7-sided Rubik’s cube.
Here is a chart that shows it well. This shows the number of active monthly listings going back to 2015 for both the Niagara Region (in red) and St.Catharines (in grey).

Here is the plot twist. With active listing inventory at these levels, along with lagging sales (20-25% below the 10-year average the last few months), you’d think prices would be coming down.
They’re not.
If you’d like to read more about that, click here to check out our blog from the end of May.
So, what do you do with this info?
If you’re a seller, make sure your pricing is locked in and makes sense with the competition.
If you’re a buyer, pick your target, get your ducks in a row, and jump in. Click here to read more on that too :)
Here’s hoping we get back under 3,000 in July.
Questions?
