

WOAH.
It feels like we’ve had 5 years of “wow, can you believe this market?” here in Niagara real estate.
Whether you’re looking at homes in St.Catharines, Fonthill or Fort Erie, the market activity and overall supply & demand have been incredible.
Let’s have a quick spin through the market conditions right now (April 1st) and over the recent past for real estate in the Niagara Region.
First, let’s look at March 2021. A lot of reports are going to come out about March 2021 versus March 2020 and those reports are going to be something like this:
March 2021.
Number of New Listings UP 60%
Number of Sales UP 98%
[insert fire emoji here]
The question is…
Are these numbers a reflection of how strong March 2021 was? Or how weak March 2020 was?
It’s a combo pack reflection of both. These virtually illogical numbers are directly tied to March 2020 being shut down by COVID and March 2021 being overly active as it awakens from lockdown.
Looking at March 2020, the 2nd half of the month produced about half of the normal number of sales. In fact, in Niagara, there were 270 sales in the 2nd half of March 2020 which was down from the nearly 500 sales that was the average over the previous 5 years.
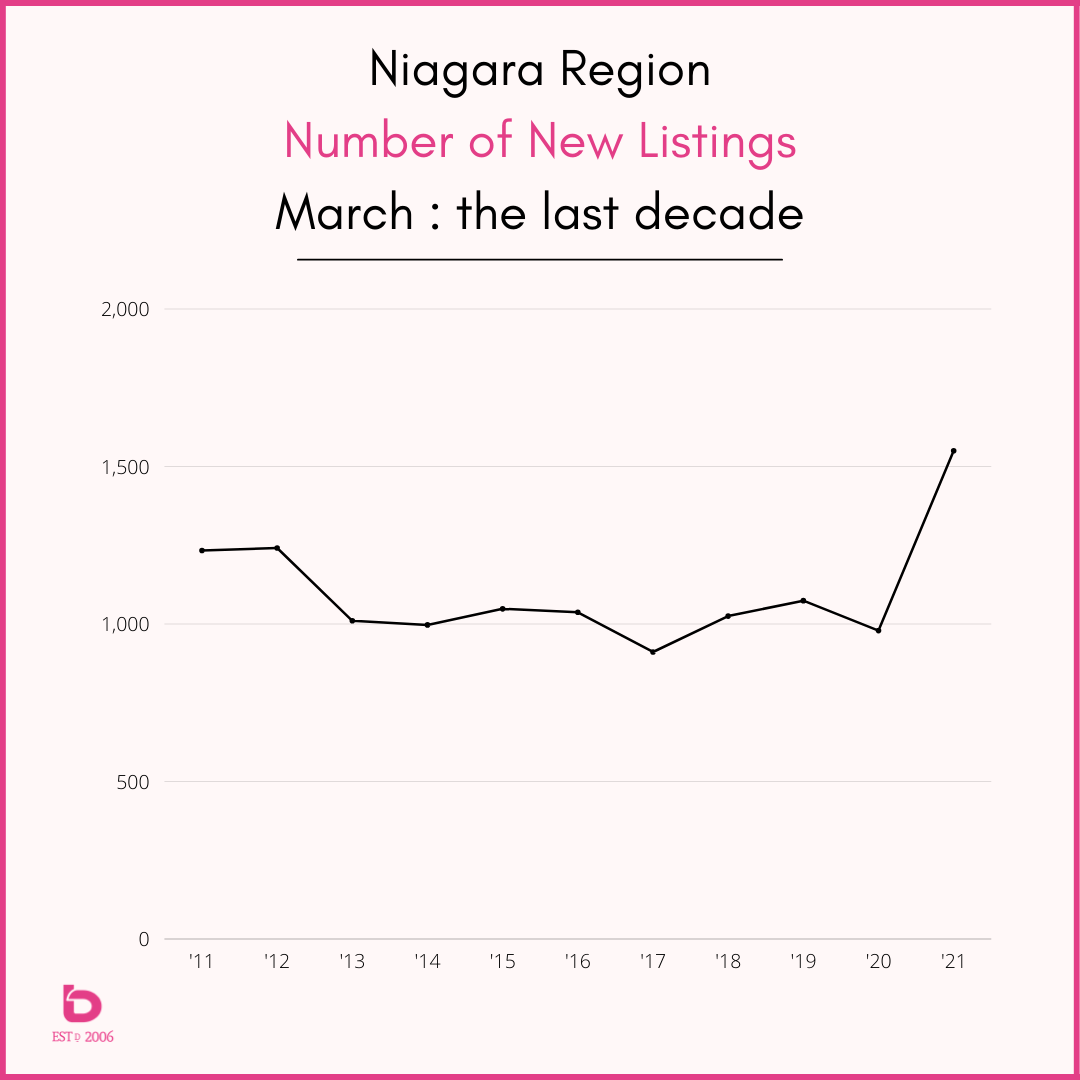
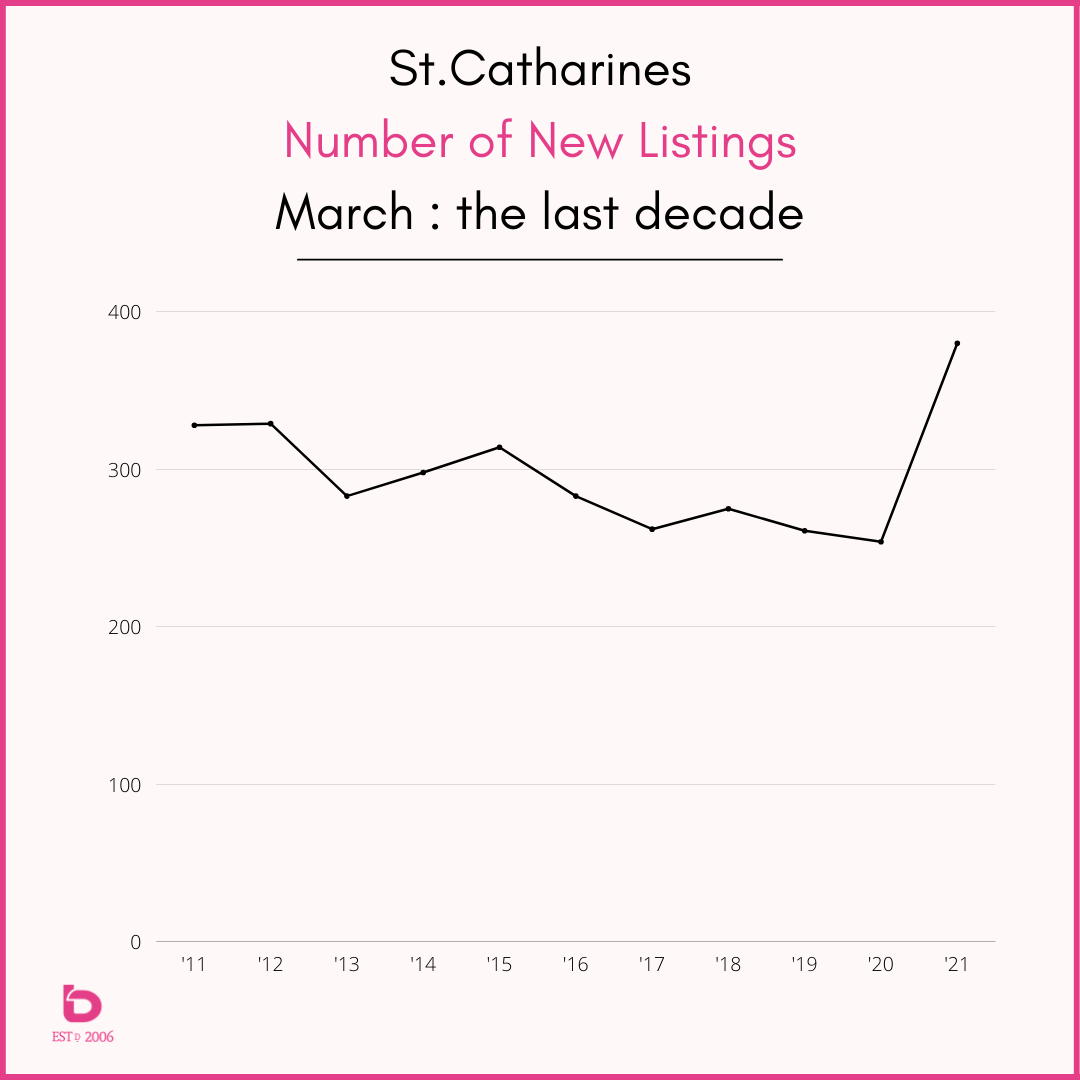
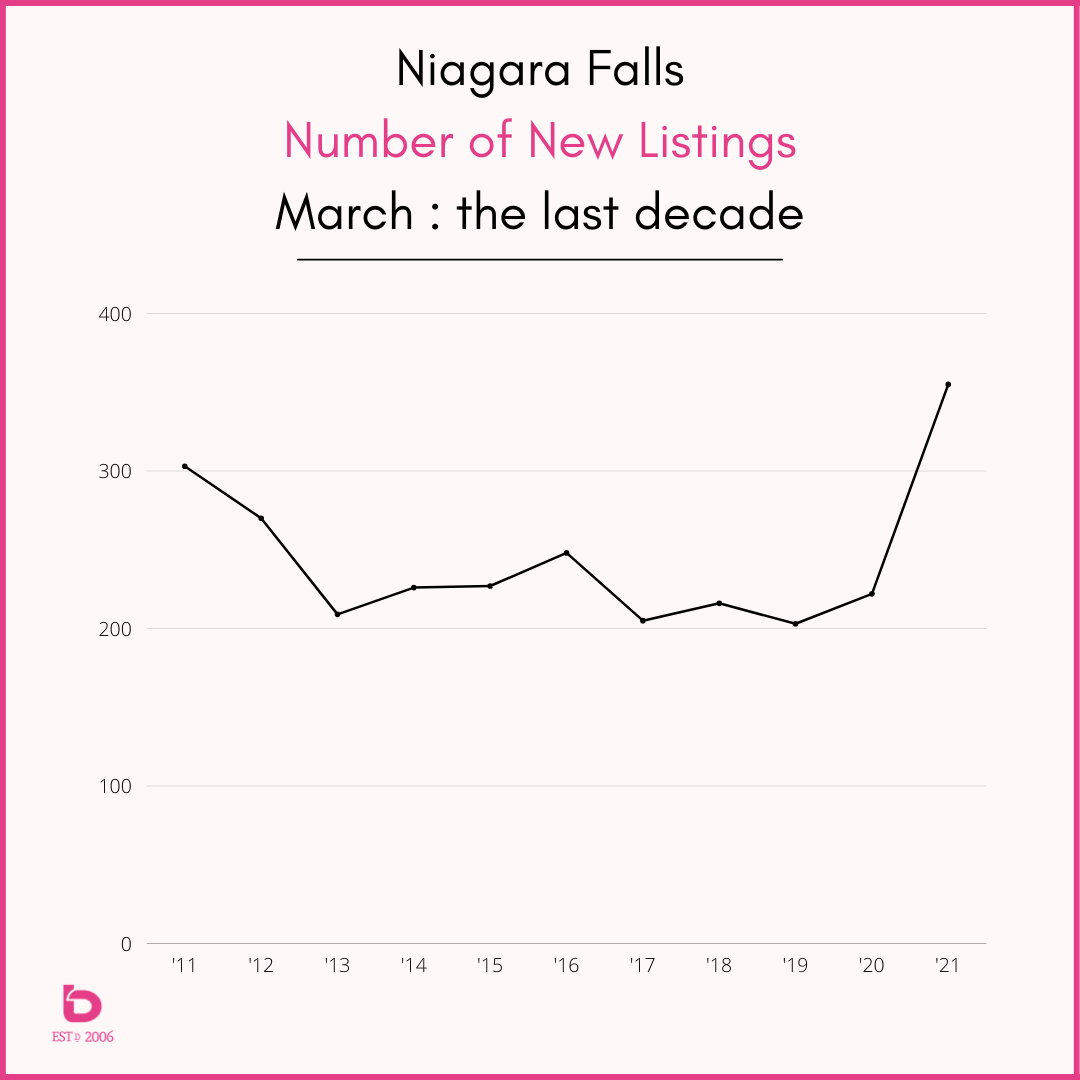
So, let’s look at March for Niagara as well as the 2 highest sales volume cities in Niagara which are St.Catharines and Niagara Falls.
These graphs show you the Number of New Listings (supply) for the months of March going back from 2021 to 2011. Note how strong March 2021 was in comparison:
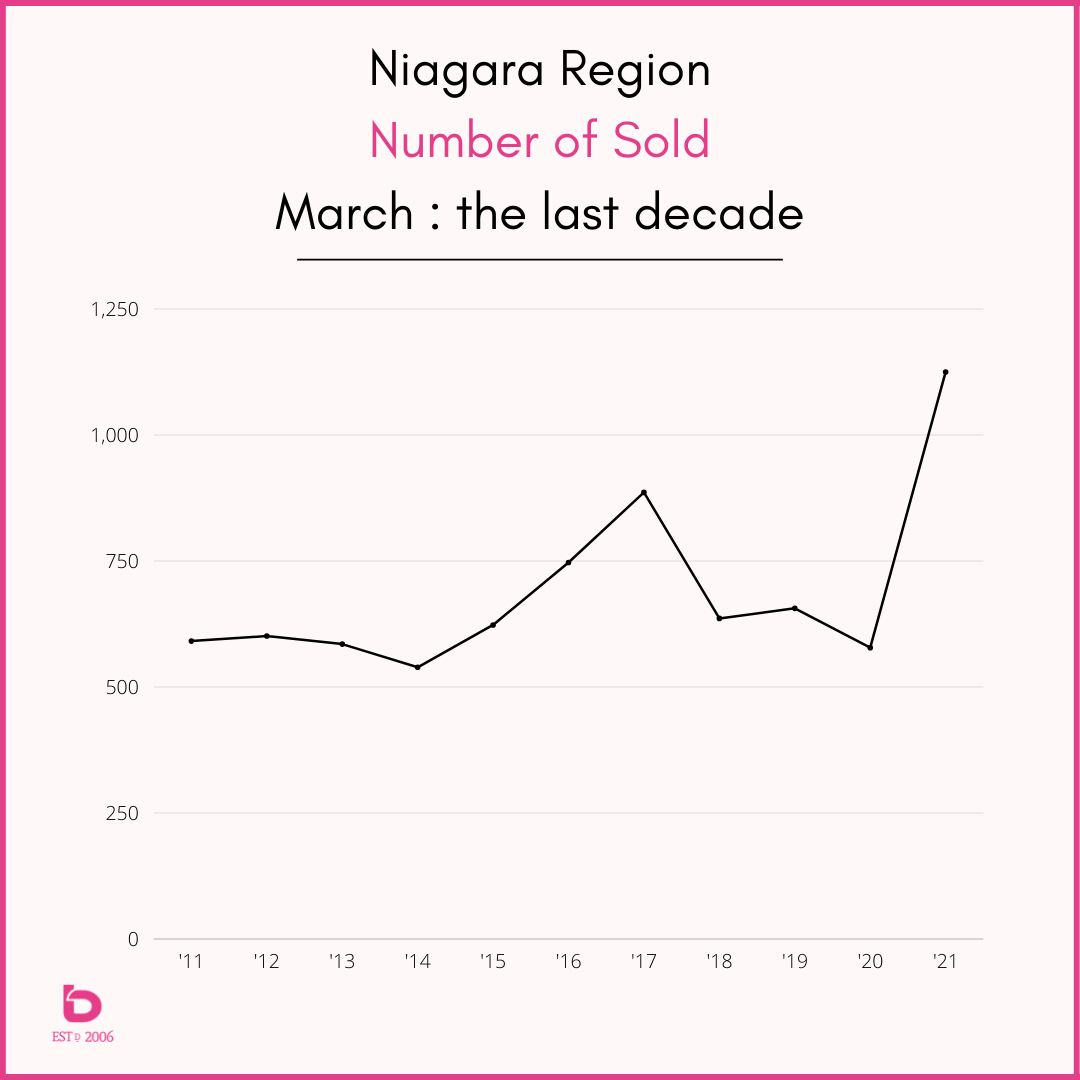
Now, let’s look at the Number of Sales (demand) over that same time period:
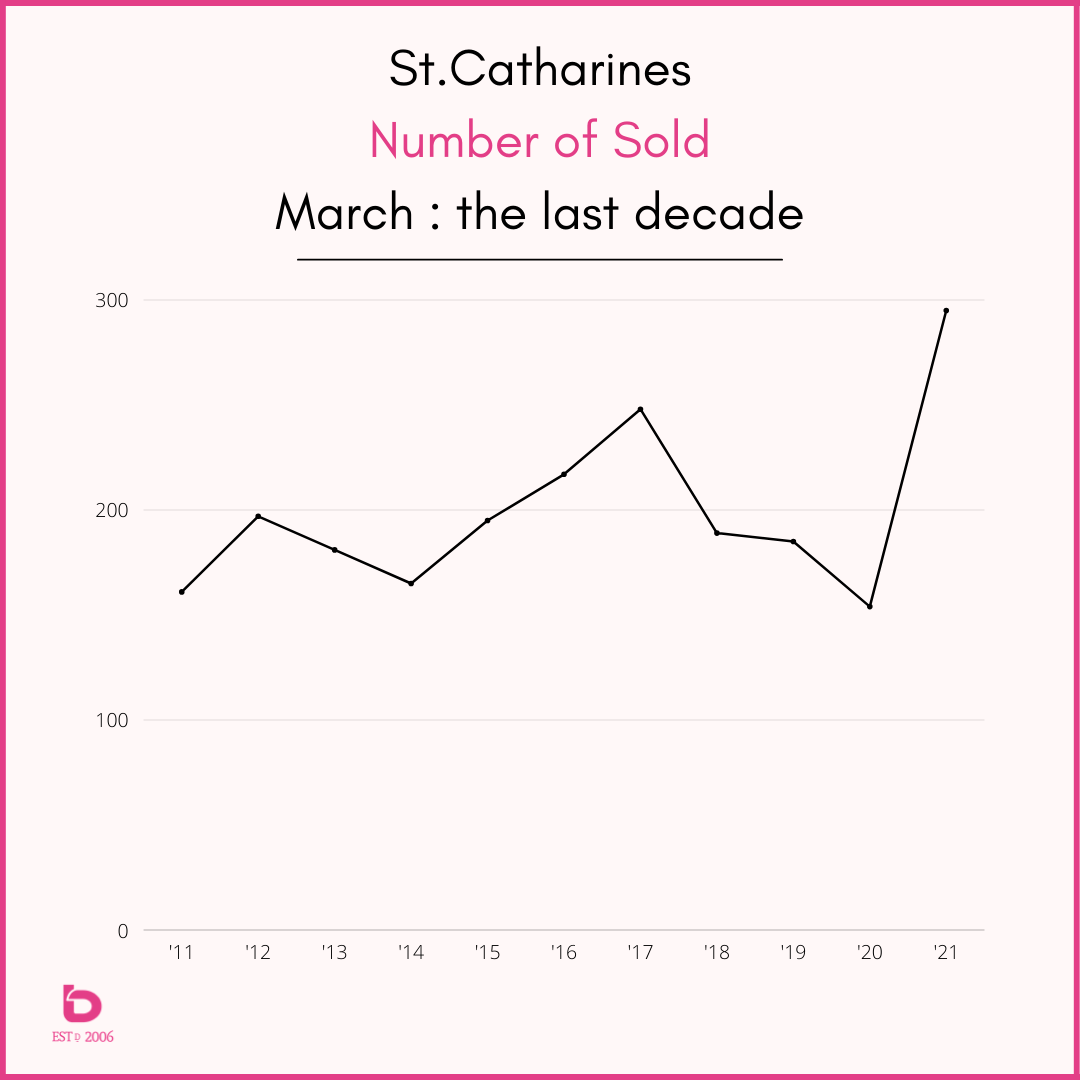
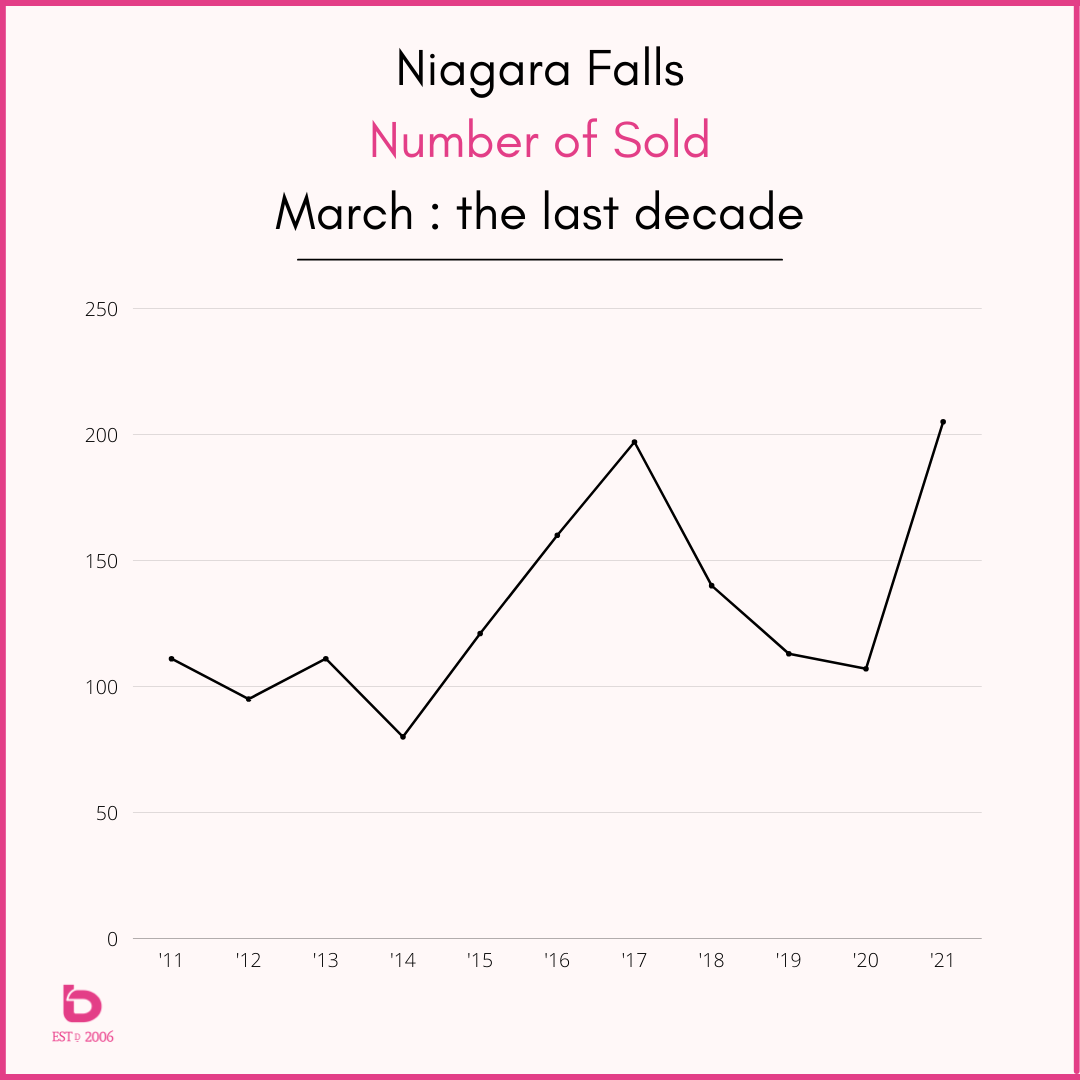
How to make sense of these numbers?
In a time of outliers, it’s helpful to look at longer term in order to put the current data into context.
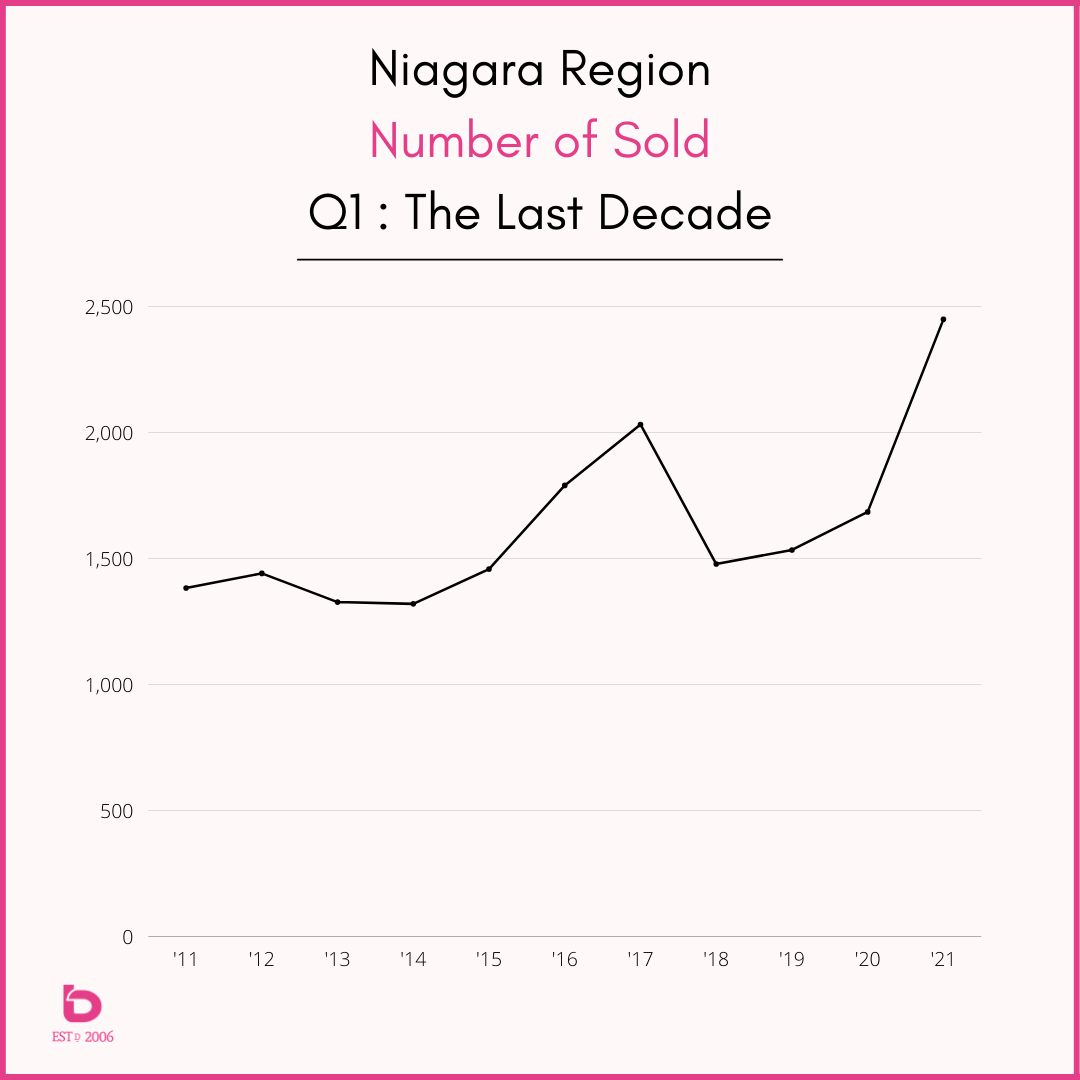
It’s important to remember that January and February 2021 both had historically low new listing inventory so to see Q1 producing such massive numbers in comparison to the last 11 years is that much more impressive.
So, these graphs have a look at the 1st quarter (Jan - March) for 2021 back to 2011.
Have a look here:

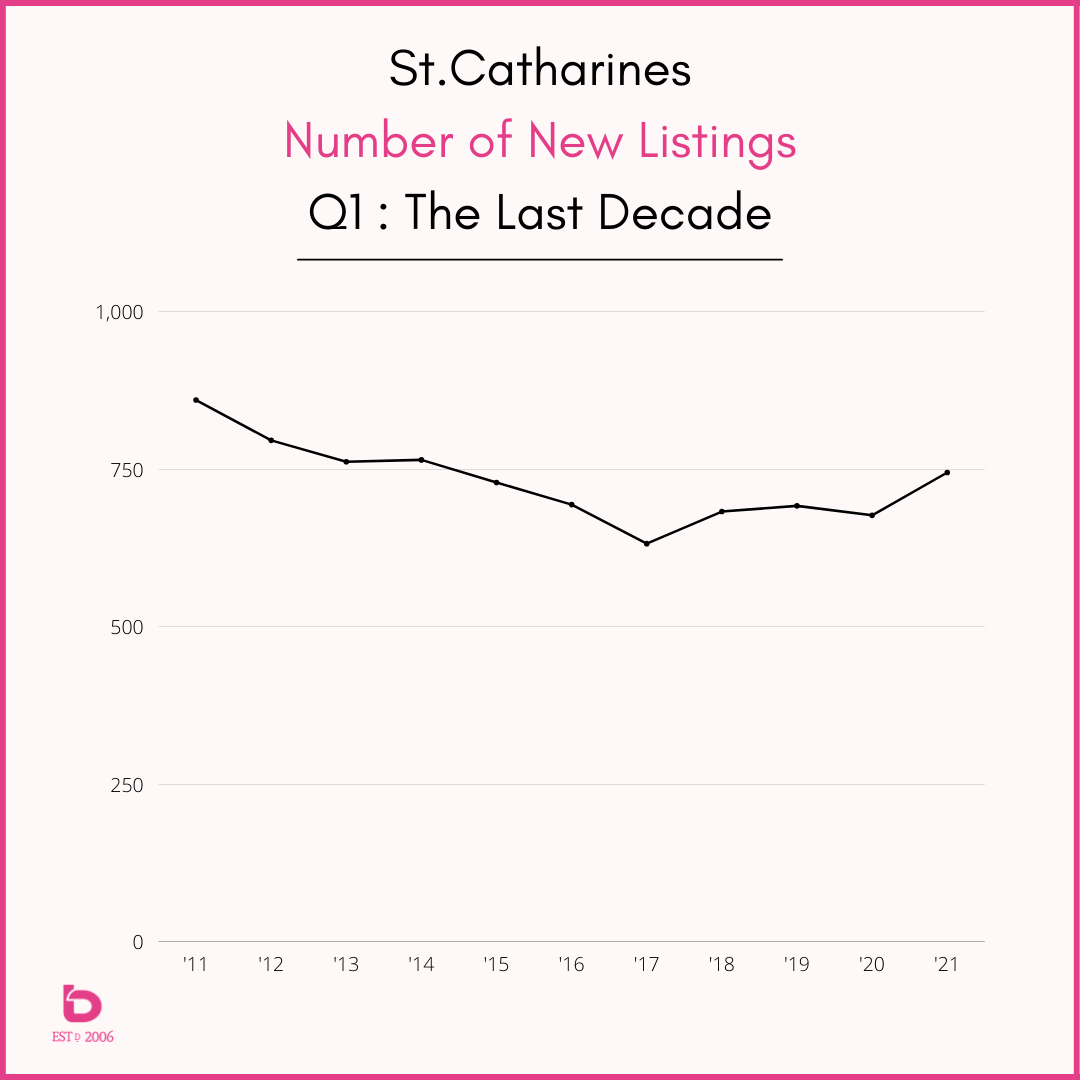
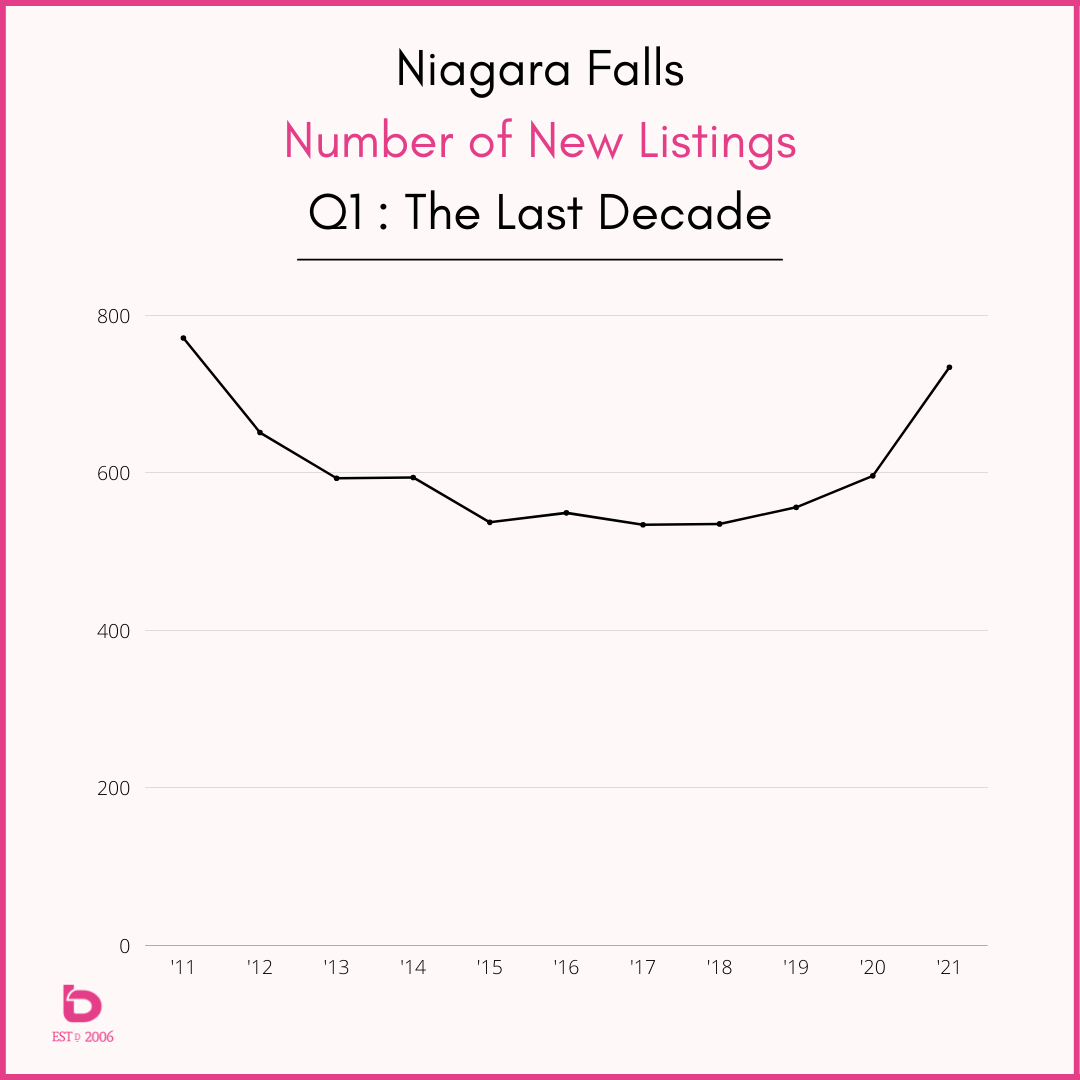
That "wobbly U" shaped pattern repeates itself across almost all of Niagara. So, thats the supply. How about demand?
How about the level of demand (Number of Sales)?
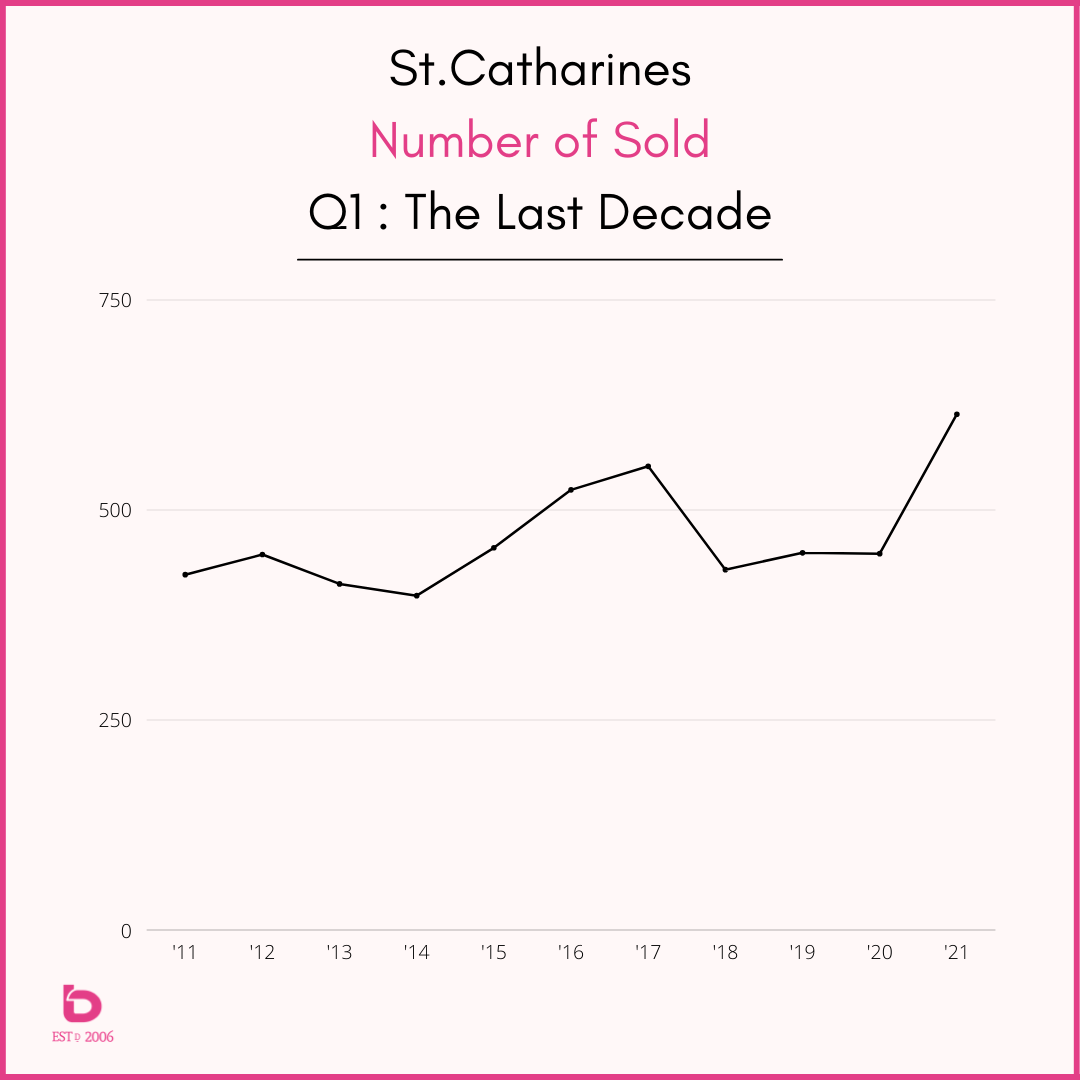
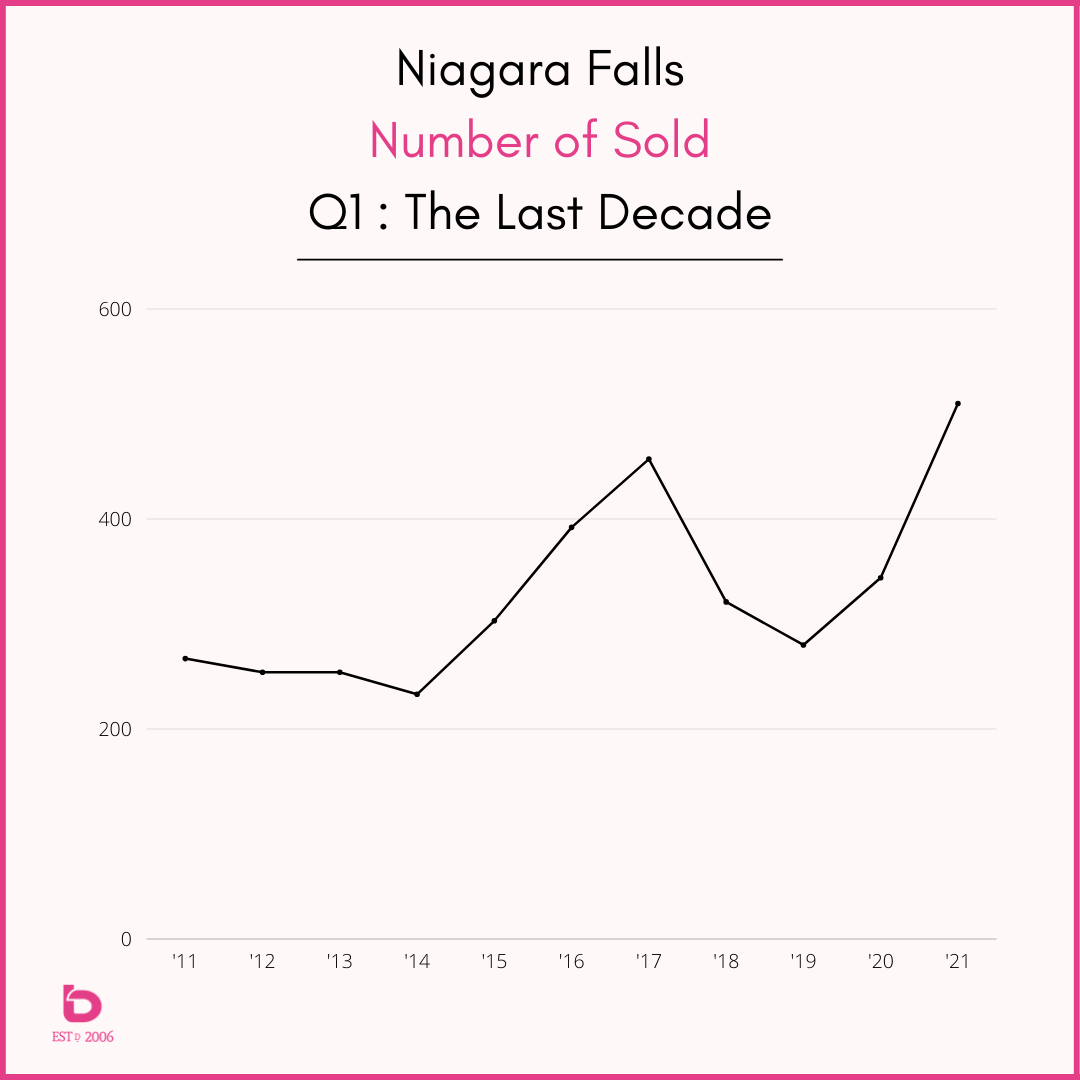
Through the last 6 - 7 months we have seen intense and virtually relentless demand across the entire Niagara Region. As a result, we're seeing some incredible records being set.
Here is a look at Q1 (Jan - March) for 2021 going back to 2011 for the Niagara Region, St.Catharines and Niagara Falls.
So, where do we go from here?
Our expectation is, lockdown notwithstanding, the next 60-90 days are going to be extremely active as the supply of new listings improves alongside this continued demand.
Are you a home buyer? Choices for you home buyers will improve but how much the supply can offset that heated competition remains to be seen.
If you’d like to watch the video version of this bLOG, have a watch here:
Thank-you for joining us. Any questions or thoughts are always welcome!