As we dive into the fall season, let’s take a look at the current state of the real estate market in Niagara. With significant new listings hitting the market and sales lagging, there are a few key insights to help sellers and buyers alike understand the trends shaping the region.
Conditionally Sold Properties on the Rise
As of now, there are 239 conditionally sold properties in Niagara, with 59% of them sold subject to sale of the buyer's property (SOP). This figure has been gradually increasing over the past three to six weeks, making it an important factor for sellers to consider when reviewing offers. The average cumulative days on market (CDOM) for SOP-sold properties is 121 days (with a median of 92). This suggests that sellers who have been on the market for an extended period may be more inclined to accept offers that may not meet their initial expectations.
CDOM Insights for Active Listings
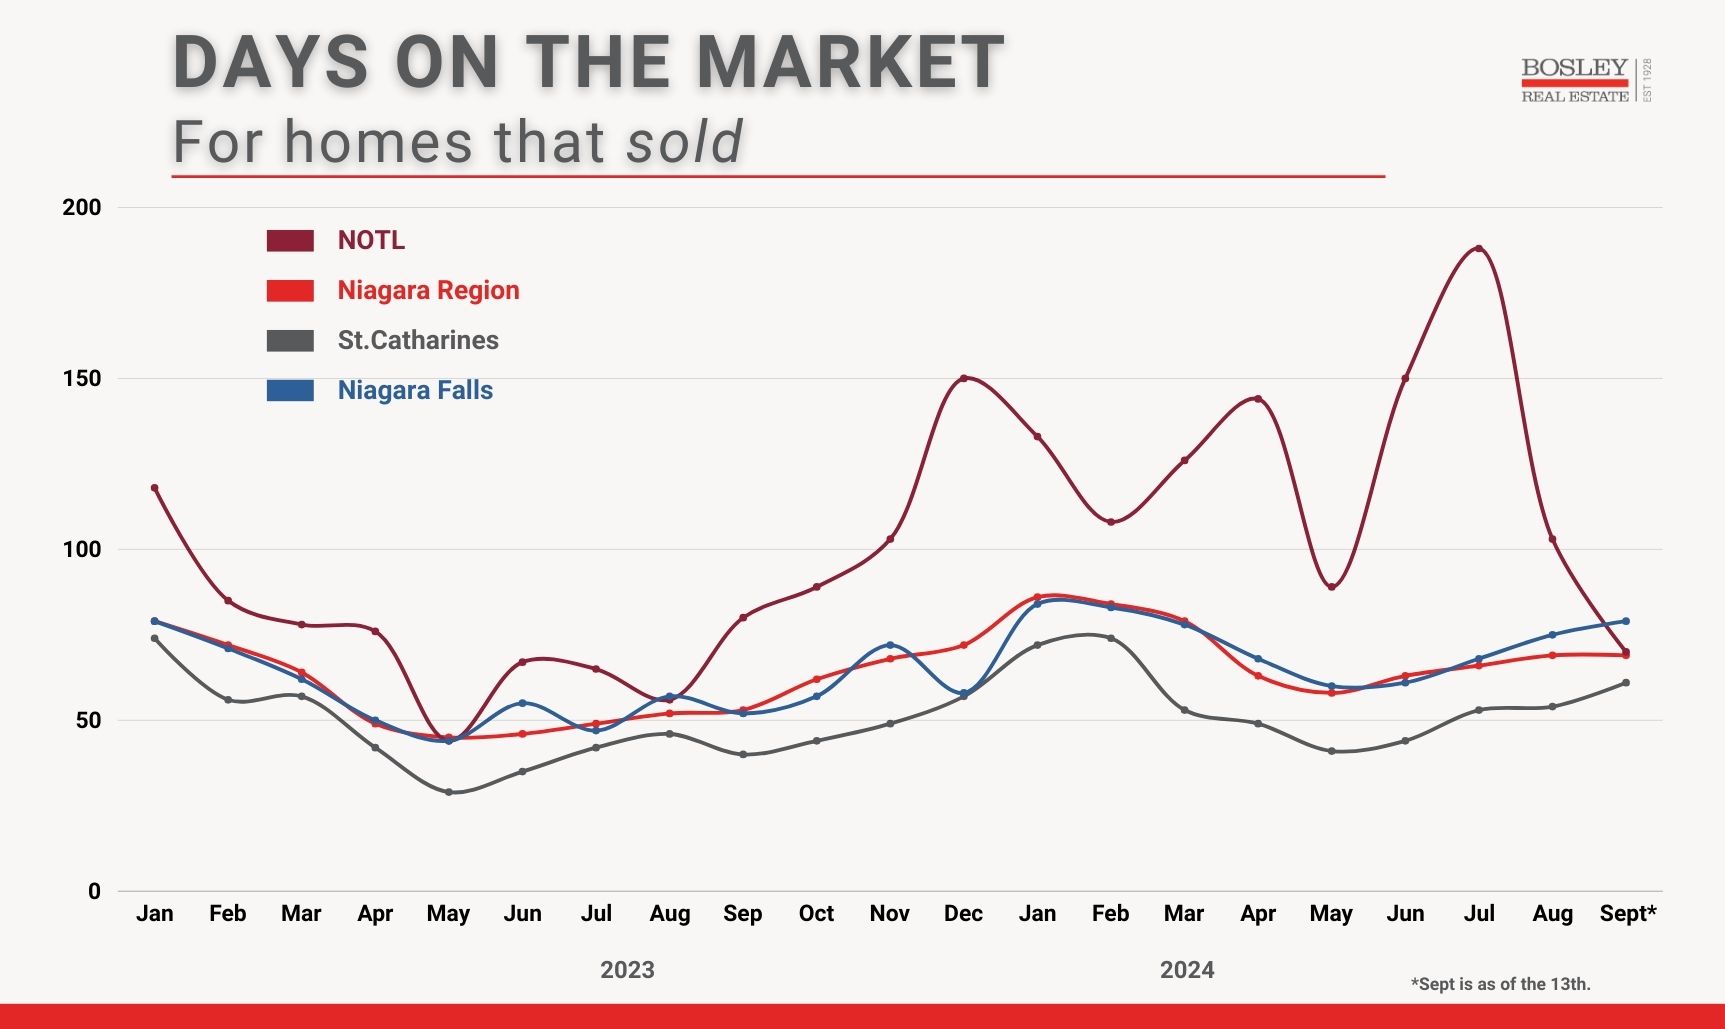
For all active listings in Niagara (currently 3,217), the average CDOM is 107 days. When we exclude new builds, this number drops to 94 days. It’s important to note that this data below reflects homes that have sold within the month, meaning there is some volatility—especially in areas like Niagara-on-the-Lake which have less sales so the data can easily be skewed.

How Time on Market Affects Sale Price
Another critical factor to consider is how the number of days on market (DOM) impacts the sale price. Here’s a breakdown of sale price ratios for properties sold in the last 30 days based on DOM:
- 0-14 Days: 99.5% of asking price
- 46-60 Days: 96.6% of asking price
- 76-90 Days: 95.1% of asking price
- 151-180 Days: 93.8% of asking price
The longer a property sits on the market, the more likely it is that the final sale price will be lower than the original asking price. For sellers taking a “let’s see what happens” approach, this data highlights how time on market is not on your side.
New Listings Surge in September
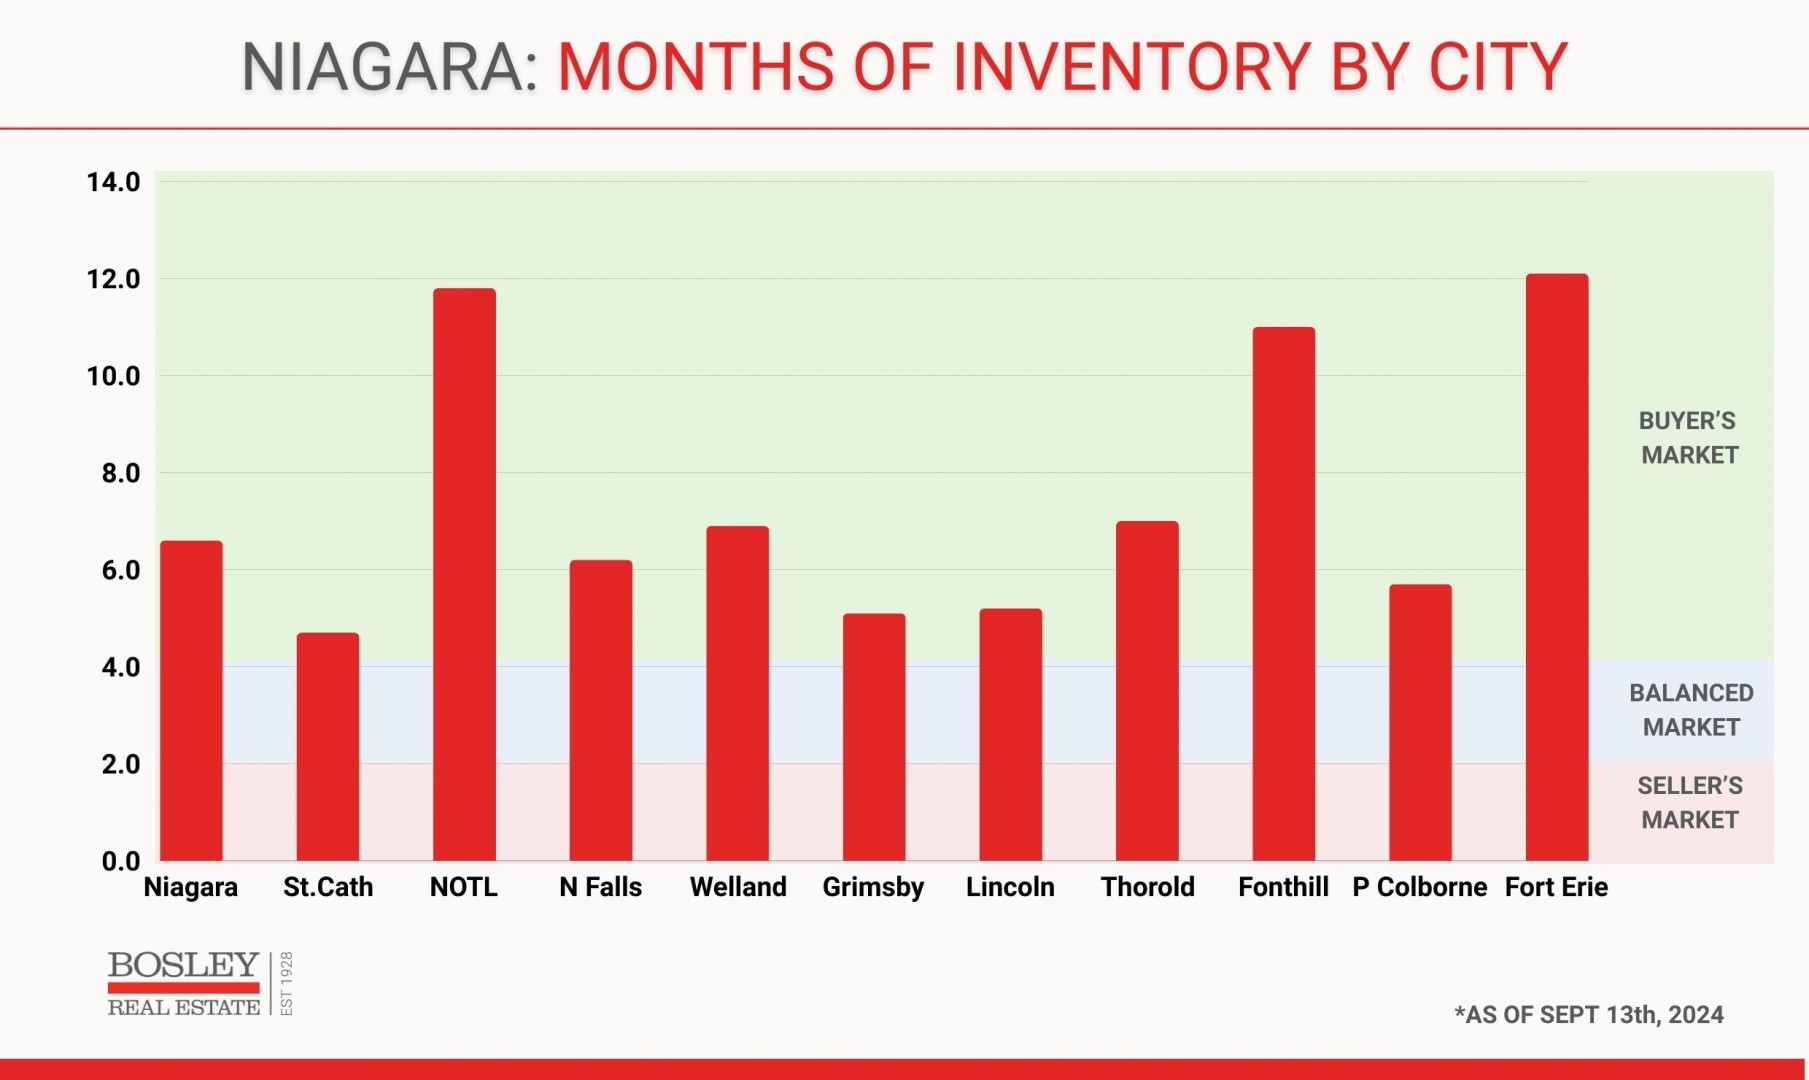
September has already seen a significant influx of new listings, but sales continue to lag, which has caused months of inventory (MOI) to creep up again this past week. Despite the increase in listings, buyers seem to be holding off, leading to longer times on market and a potential dip in sale prices.

September Sales Trends: How Does This Year Compare?
The first 13 days of September 2024 saw 187 sales, a slight improvement from the same period in previous years:
- 2023: 169 sales
- 2022: 170 sales
- 2021: 290 sales
While this year’s numbers are slightly better than the past two years, they remain well below the 2021 figures, where the market was much more active. Historically, the norm falls somewhere between these figures, and it’s expected that we’ll see the market balance out in the coming months.
Is the Bank of Canada Rate Reduction Helping?
Many sellers believe that a rate reduction from the Bank of Canada will immediately boost the market. However, we have yet to see a significant impact. September 2024 is currently on pace for around 460 sales, which would mark the fourth consecutive month with sales 25-30% below the 10-year average. This stat is important for sellers to keep in mind when pricing their homes—overly ambitious pricing could result in longer days on market and lower sale price ratios.
Final Thoughts
The Niagara real estate market is showing signs of shifting, with sales still lagging despite an increase in listings. Sellers need to be aware of how time on market can impact their sale price, and both buyers and sellers should keep an eye on how external factors, like interest rate changes, will influence the market moving forward.
As we move through September and into the fall, it will be interesting to see if the market regains momentum or if the current trends continue.
Stay tuned for further updates!
