

WELCOME TO THE BOSLEY REAL ESTATE 2024 NIAGARA REAL ESTATE MARKET REPORT
If you are looking for a deeper dive into the data not only for our region, but also for its various cities and towns, Bosley Real Estate Ltd., Brokerage, has assembled this report for you.
A few housekeeping items:
- the data is from the MLS system of the Niagara Association of Realtors (NAR)
- NAR went through an MLS provider change that started in November 2024. As a result, some of the data for the last 5 weeks of the year will have a very small margin of error. The data is as close to exact as possible.
...and now back to the report...
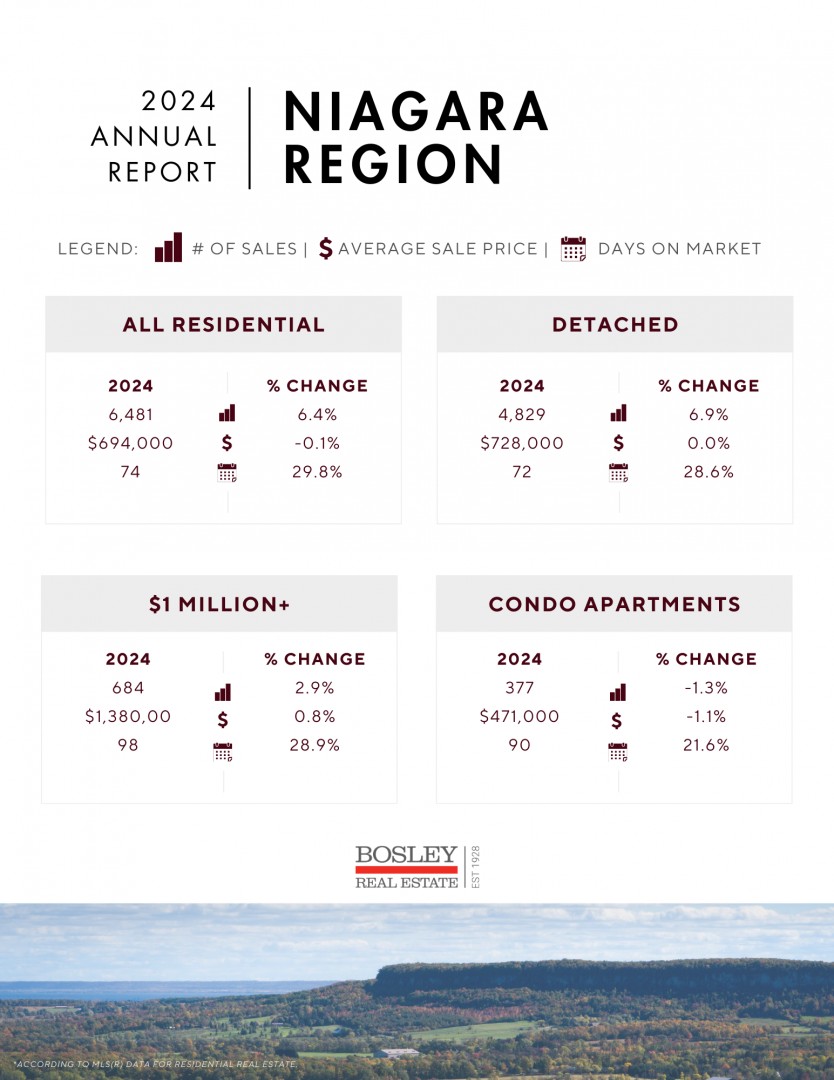
Since 2016, the Niagara real estate market has been experiencing significant year-over-year changes, with all-time records set across nearly all segments of the market data. Since then, we have seen multiple years with annual average sale price increases of 20% or more, record-high annual sales (2021), record-low annual sales (2023), record-high inventory levels (2024), and much more.
What caused all of that volatility? It was a confluence of events, which included the influx of buyers from the GTA, a global pandemic, and a roller-coaster ride of overnight interest rate changes. At its core, the data was driven by market sentiment, which remains the key factor to watch as we head into 2025.
We hope you find the enclosed information relevant and helpful. If you would like a closer look at a specific area of the market or a particular property, we are happy to put that together for you.

Unprecedented Five Years
The market data over the past five years (2020-2024) has been nothing short of incredible, as it continues to show the rippling effects of COVID. During that time frame, we have seen numerous records set, some for better and some for worse. Whether it was record-high annual sales (2021), record low annual sales (2023), or explosive price growth, it’s been a wild ride. After such volatility, it was reasonable to expect a market that would pause and catch its breath—which is exactly what we saw in 2024.
Compared To What?
While the overall data was weak, when considered in the context of broader market conditions, there are some definite positives to consider. After a historically weak 2023 (lowest sales of all time for Niagara), comparing 2024 sales won’t paint a fair picture. What is notable, however, is that 2023 finished off with sales that were 25-40% below the 10-year average. As we worked through 2024, sales showed signs of improvement, coming in 7-15% below the 10-year average over the last four months of the year.
While underwhelming at first glance, the trends in Q4 showed a market with some modest momentum.
What Is My Home Worth?
Whether looking at sales, inventory or days on market, the data that most buyers or sellers are curious about is the average sale price. After such enormous growth in previous years, we saw a flattened trend from summer 2022 through the end of 2024.
In fact, when looking at the last half of 2022, 2023 annual and 2024 annual, both the average sale price and median sale price were flat, with the average at $695-700,000 and the median at $630-635,000. After so many years of significant annual price appreciation, this stagnation has been a source of frustration for sellers. Note: while the last few years have stumbled, the market is still up 71% since 2017.
Silver Lining
Available inventory (active listings) set new record highs in 10 of 12 months in 2024. Given the combination of lagging sales and high inventory, it’s impressive that prices held steady.
With the Bank of Canada starting to dial back the overnight lending rate, an infusion of buyer demand will only help to reduce available inventory, lower the record-high days on the market, and bring some form of normalization to the marketplace.
What To Watch For
Keep an eye on key market indicators, particularly available inventory and monthly sales relative to the 10-year average. Seeing that dynamic slowly start to improve towards the end of 2024 is an encouraging sign for a more productive 2025.
Stay In Touch
2025 is poised to be an interesting year in Niagara real estate. With so many aspects of the market—and life in general—in flux, local and timely insight will be critical. If you’d like to discuss this report or real estate in general further, please don’t hesitate to reach out.

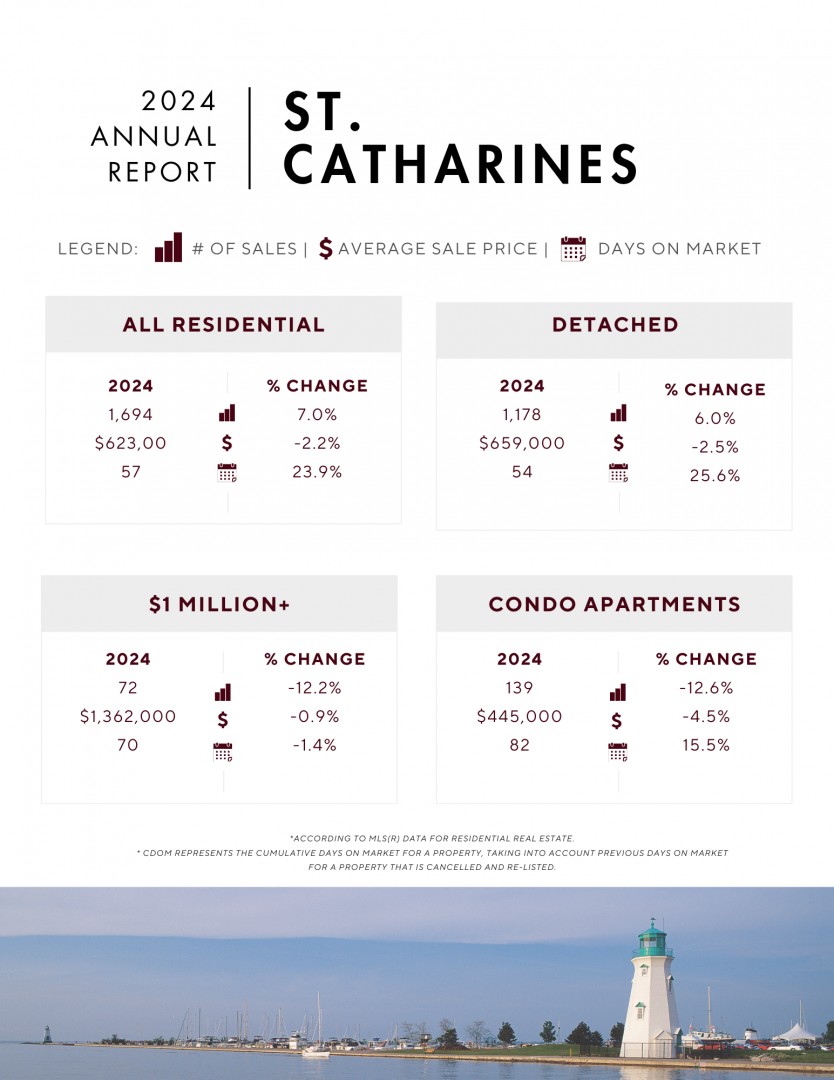
A Mixed Bag Of Sales Data
Sales to start 2024 were notably strong, coming in almost equivalent to the 10-year average. After a challenging 2023, this was a welcome change. March then proceeded to set a new all-time record for the lowest monthly sales, coming in at 153 sales, which was slightly lower than COVID-era March of 2020.
Sales in the summer months lagged, ranging from 25-43% below the 10-year average. However, similar to regional trends, the final four months of 2024 finished up much stronger, showing progress towards normal levels.
Sale Price Bell Curve
Similar to the regional numbers, the average and median sale prices for St. Catharines remained notably flat over the 30-month period from June 2022 through December 2024. Even so, 2023 and 2024 showed definite consistency, with price growth through Q2 into the summer, followed by an ebb in the numbers in the last four months of the year.
When looking at annual averages, both average and median sale prices came in at their lowest since 2020. While the first four months of 2022 skewed the data, the annual average has declined slightly over the past three years—a trend not seen in at least 20 years.
Patience
While prices have been underwhelming, homes that were priced accurately still found a buyer in a reasonable amount of time. For example, in the north-end of the city, detached homes (excluding waterfront) sold for an average of $706,000 (98% of asking) in 2024, with an average of 52 days on the market. All things considered, that was not a bad performance.
Record Number of For Sale Signs
Similar to the rest of the region, there was no shortage of available inventory in St. Catharines in 2024. In fact, the last eight months of the year set new all-time record highs for each respective month, averaging 50-65% above the 10-year average. The peak was in Q3, with some improvement in Q4 as sales activity improved.
The Impact of Being Landlocked
With no room to grow, growth in St. Catharines will be limited to infill and redevelopment of existing land. As a result of those constraints on supply, the various segments of the market will continue to garner similar attention. Whether it is bungalow townhomes, downtown starter homes or north-end detached homes, we expect to see improvements across the board in 2025.
What To Watch For
With approximately 300 listings expiring on December 31st, it will be interesting to see how many of those sellers jump back into the market, and how many decide to stay put. As interest rates improve, renewed optimism runs the risk of contributing to further overpriced homes on the market, potentially prolonging the market’s slow recovery.
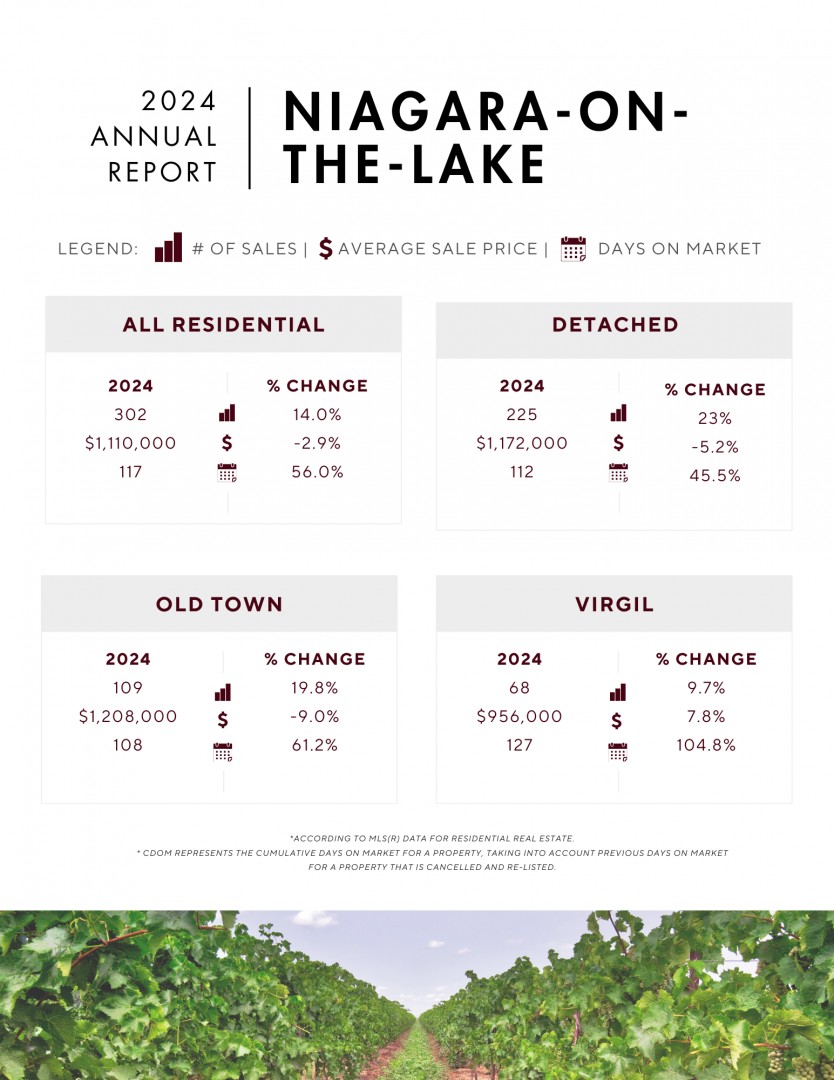
A Varied Marketplace
A wide geographic spread combined with low monthly sales volumes is bound to produce volatile data. That is definitely the case for NOTL. With 20-30 sales per month, it’s important to gather further context when viewing any data. Regardless of market conditions, however, the largest amount of sales activity tends to take place between March and July, and that trend was once again the case in NOTL in 2024.
Monthly Sales
When looking at NOTL as a whole, the monthly sales trend stabilized in Q4, with totals coming in at 10% below the 10-year average. After running at 29% below the 10-year average in Q3, the finish to the year was a step in a much-improved direction.
First Place Pricing
NOTL continues to hold the title for highest average annual sale price and remains the only city in Niagara with an annual average sale price exceeding $1 million. The average in 2024 was just over $1.1 million, marking the fourth consecutive year that the annual average has surpassed the million dollar mark.
Similar to the rest of the region, when the historically unprecedented first half of 2022 is excluded, NOTL’s annual average sale price has been relatively flat since 2021, fluctuating within the $1.1-1.6 million range.
Growth in Virgil
On a monthly basis in 2024, new construction accounted for 35-55% of all active inventory in Virgil. Whether it was bungalow townhomes, retirement bungalows or large executive homes, there has been no shortage of construction vehicles in the area.
The challenge has been finding buyers to snap up the inventory. Not all new construction properties make their way to the MLS, but for those that were listed, they sold at an average rate of one sale for every 16 properties listed.
Old Town
Sales peaked in 2021, bottomed out in 2023, and made a modest comeback in 2024, with 87 detached sales. The average sale price in 2024 was $1.33 million, down from the peak in 2022 but similar to 2021 levels. With sale prices ranging from $700,000 to nearly $4 million in 2024, a closer investigation is essential when evaluating a specific property.
The Upper Upper-End
The market for properties priced over the $2 million mark struggled in 2024. In any given month, there were 40-60 properties listed for sale in this price range. However, there were only 18 sales throughout the entire year, with an average of 232 days on the market.
What To Watch For
All things considered, with just over 300 sales for the year, the NOTL market performed fairly well in 2024. Improving sales and comparatively stable sale prices suggest that 2025 could build on the momentum from late 2024. Just keep an eye on the GTA market and influence of out-of-market activity.

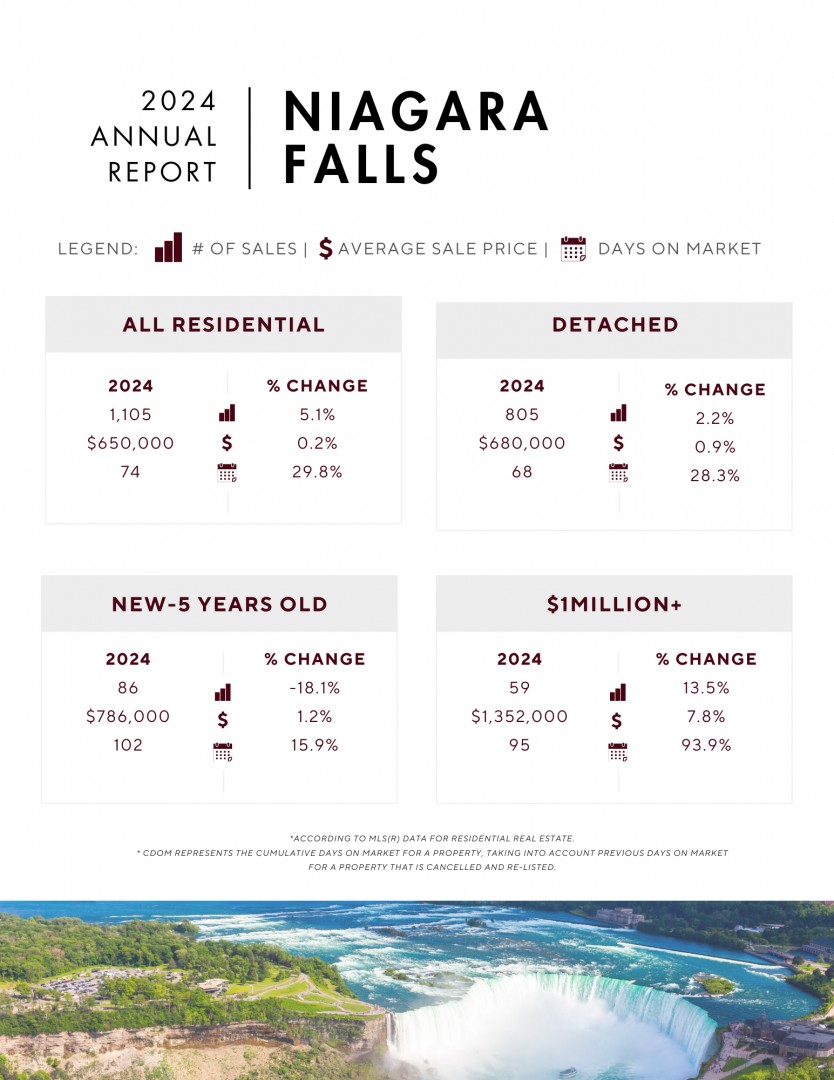
A Different Market
While Niagara Falls is the second largest marketplace in Niagara, it is unique in terms of overall supply and demand dynamics. With a significant number of investors impacting both the supply and demand sides, the Niagara Falls data tends to be more susceptible to larger market shifts.
For example, the number of tenant-occupied active listings in 2024 was slightly more than double what it was only a few years ago. It remains to be seen how the Bank of Canada’s (BoC) interest rate changes will influence those investors.
Lagging Sales
In terms of the number of homes sold, it was a summer to forget in Niagara Falls. From June to August, sales came in 31-36% below the 10-year average, with August setting a record low for sales in that month. That being said, overall sales improved in Q4, coming in at 16% below the 10-year average, which was the best quarterly performance in the past few years.
Sale Prices
Similar to the Niagara Region, the annual average sale price for Niagara Falls in 2024 was nearly unchanged compared to 2023. In fact, the second half of 2022, 2023 annual average and 2024 annual average were within $2,000 of each other. While prices lagged over the past few years, 2024 still finished 26% higher than five years ago, settling in with an average sale price of just under $650,000.
Detached North of the 420
This area of the city produces a significant portion of the annual sales. When looking at detached homes, annual sales for 2023 and 2024 were fairly consistent, with approximately 250 sales each year. Similarly, the average sale price was in the $675,000 range. While this is down from the peak 2021 and 2022 markets, it is up 26% from 2020.
Plenty To Choose From
While sales struggled through the summer, buyers had no shortage of choice. The last nine months of 2024 set monthly records with active listing inventory coming in at 45-65% above the 10-year average. Supply found a “cruising altitude” for the back half of the year, as sellers stuck to their pricing guns and buyers waited for better pricing and/or lower interest rates. In the end, it was a stalemate.
What To Watch For
Here in early 2025, no less than 51% of active listings in Niagara Falls are either vacant or tenant-occupied. With an average of nearly 100 days on the market, it will be interesting to see what these sellers do. Many will hope that buyers catch up with more normal demand levels, but there is still a lot of slack to be tightened. Watch how sales and inventory interact with the 10-year average. If Q4 2024 trends continue, we may see a slow and hopefully steady stroll towards more normal levels.

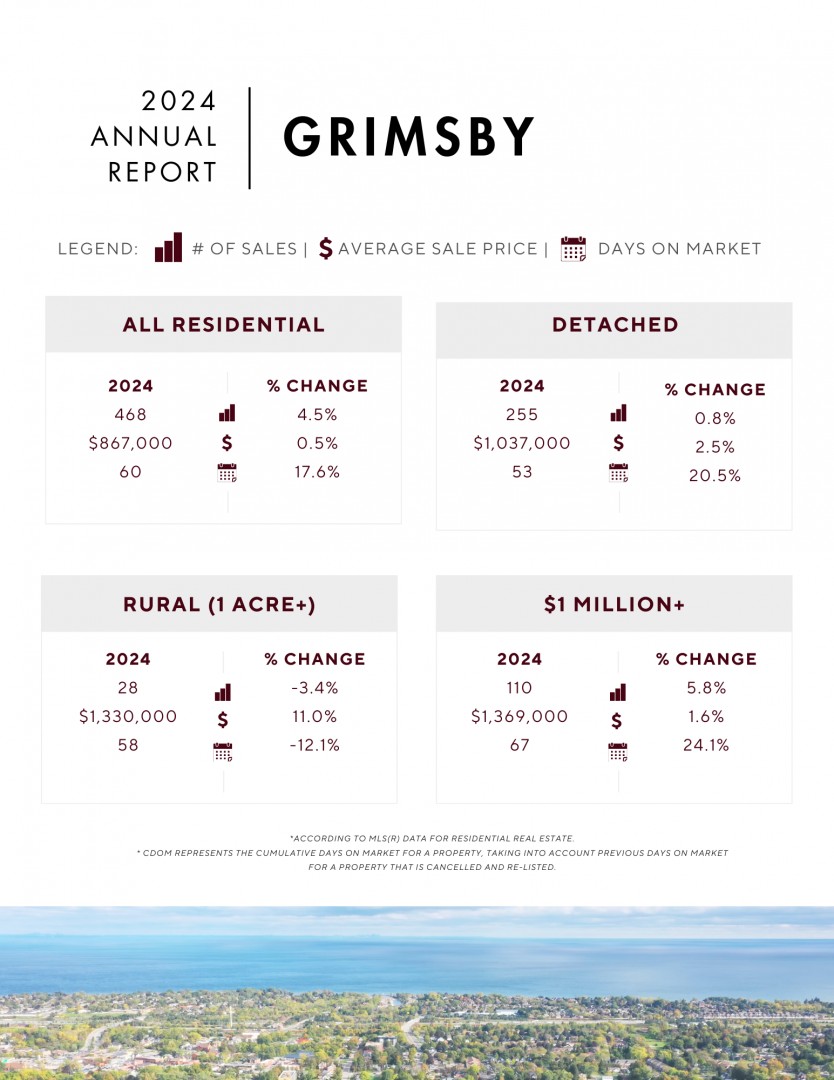
A Brief Pause
After five years of substantial and consistent sales growth from 2017 through 2021, annual sales in Grimsby took a breather over the last few years. Similar to the rest of the region, the second half of 2022 through 2024 was remarkably consistent. 2021 remains the high-water market for annual sales with just over 700 sales for the year, while 2022 through 2024 saw a more typical range of 450-500 annual sales.
Monthly Sales
2024 got off to a fairly strong start, with sales matching the 10-year average. That momentum was short lived, however, as Q2 limped to the finish line at 28% below the 10-year mark. As market sentiment improved, so did sales, with Q4 battling back to nearly match the 10-year average, which is a great sign as we head into the 2025 spring market.
Pricing Trends
While all cities and towns in Niagara have experienced substantial price growth in recent years, Grimsby has been in another league. Over the past decade, the average sale price has increased by 114%, while the 5-year growth rate was just under 50%. So, with that much appreciation, leveling off over the past four years isn’t surprising.
On an annualized basis, the averages for 2021, the second half of 2022, 2023 and 2024 have all fallen within the $845,000-860,000 range. As we head into 2025, a move towards more normal sales levels should be expected before any significant price growth resumes.
Million Plus
Prior to 2021, the number of homes sold for over $1 million accounted for a small percentage of the annual sales. For the five years from 2016 through 2020, sales over $1 million made up 4.6% of all sales. Over the past four years, this figure jumped significantly. Tracking along with the overall price trends, sales over $1 million jumped up to account for 23-30% of all homes sold.
Detached Homes
While the residential average has remained in the mid- $800,000s, the detached market has averaged over $1 million for the fourth year in a row, with 2024 coming in at just under $1.04 million. Considering the average sale price of a detached home in Grimsby in 2019 was $670,000, the fact that it remained above a million in what were historically challenging markets is noteworthy.
What To Watch For
With cautious buyer demand resulting in record-setting active listing inventory in 10 out of 12 months in 2024, the balance of supply and demand in Q1 2025 will set the tone for the spring market. Days on the market averages also set a record high in 2024, at nearly 70 days. Keep an eye on that number as the expected improvement in buyer demand begins to absorb some of that slack on the supply side of the market.

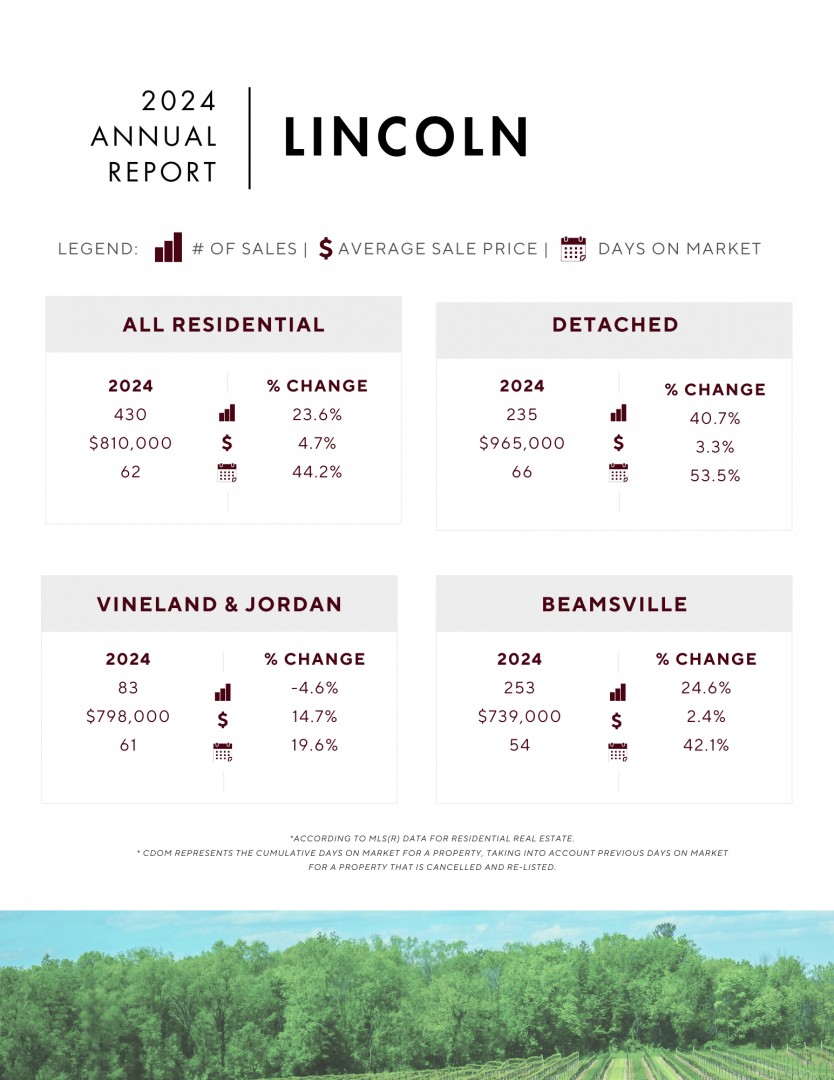
Big Changes
Lincoln blazed its own trail in 2024. While every other city and town in Niagara was in negative territory for sales when compared to the 10-year average, Lincoln was actually in positive territory, which was good for the highest annual total for Lincoln in the past decade.
How is that possible? Similar to other markets along the QEW corridor, Beamsville has seen significant growth in the mid-rise condo apartment and stacked townhouse markets, which accounted for a good chunk of the sales activity in 2024.
Geographically Diverse
Similar to other smaller markets in Niagara, Lincoln spans a fairly wide area. As a result, volatile data is often part of the equation. For example, average sales prices varied: $798,000 in Vineland & Jordan, $739,000 for Beamsville, and over a million in the surrounding rural areas. As a result of those variances, a deeper dive is necessary to narrow down values on a specific property.
Pricing Trends
In another example of Lincoln bucking the trends, the average sale price in 2024 topped $800,000, marking a nearly 5% improvement over 2023. With both sales and pricing increasing in 2024 compared to 2023, the market data is quite positive as we head into 2025.
Regardless of the step back from the peaks in 2021 and 2022, the average price of a home in Lincoln is still up 54% compared to five years ago. Keeping an eye on the real estate market in general will be important in 2025, as out-of-market buyers have driven those higher-volume markets in recent years.
Million Dollar Market
Similar to the rest of the region, the $1 million-plus market really came alive during the unprecedented market of 2020. While a pandemic raged around us, homes priced above $1 million jumped from 9 sales in 2019 to 57 sales in 2021. Sales over $1 million set an all-time record in 2024 with 70 sales, representing just under 20% of all sales.
For Sale Signs
The result of significant growth mixed with hesitant demand was longer days on the market and higher active inventory levels. 2024 reflected both, with active listing inventory doubling the 10-year average in 10 out of 12 months. The same applies to days on the market, which hit a decade-high 62 average days to sell. Watch for both of those data points here in 2025.
What To Watch For
Can the Lincoln market carry this growth and momentum into the new year? While sales and pricing demonstrated relative strength, keep an eye on overall market sentiment and how it translates to available supply, days on the market and monthly sales numbers.

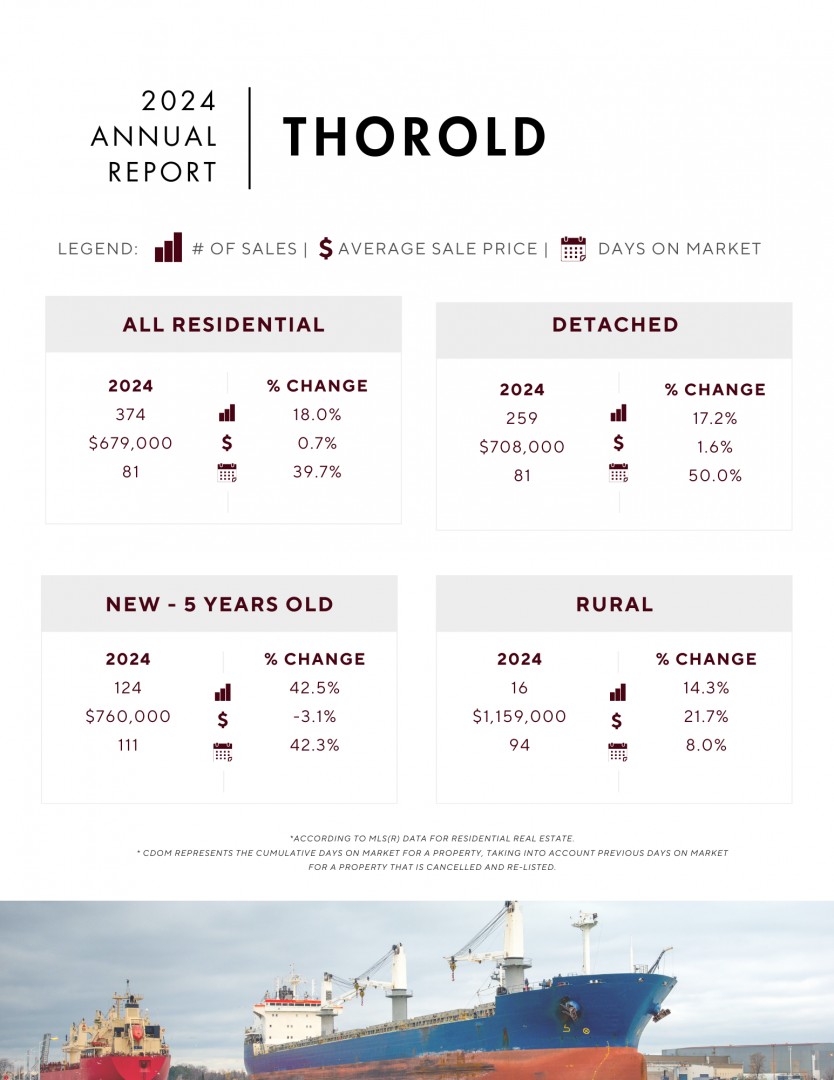
Continued Expansion
Thorold continues to expand south, with construction moving full steam ahead in Rolling Meadows as well as in the Merritt and Port Robinson Road areas. As a result, Thorold features a wide variety of real estate feeding into the data. Similar to Lincoln, Niagara-on-the-Lake and other smaller markets, it’s important to view Thorold data with further context.
Occupancy Numbers
Not all homes are traditional owner-occupied properties. The market includes vacant estate sales, vacant new construction, tenant-occupied properties, and more. For the Niagara Region, vacant and tenant-occupied homes accounted for 33% of all sales in 2024. In Thorold, where there is a higher proportion of investors and new construction, no fewer than 52% of sales were vacant or tenant-occupied during the same period.
Pricing Trends
Excluding the first six months of the year, the last four years have been marked by stability and modest growth in average sale prices. Both 2023 and 2024 recorded an average sale price of just under $680,000. While 2022 retains the top spot, 2024 is still up by 55% from five years ago.
In general, the same ebbs and flows apply across all segments of Thorold. For example, the downtown area recorded an average sale price of $554,000 in 2024—a decline from 2022 but still a 56% increase compared to 2019.
Confederation Heights Turnover
With all available land in Confederation Heights now developed, or under development, turnover in the past few years has been very consistent, averaging nearly 90 sales each year. Of these, no fewer than 50% were tenant-occupied. A challenge is that many homes in this area were never designed to house five or six students. The long-term impact of such use on values remains to be seen.
Sales Fighting Back
As in much of the region, summer sales in Thorold faced challenges, with Q2 2024 coming in 21% below the 10-year average. As the year progressed, so did the monthly sales numbers, with Q4 almost pulling even with the 10-year average. On an annual basis, 2024 performed significantly better than the previous two years, setting the stage for further progress in 2025.
Over Supply
Hesitant demand led to record-high active listing inventory in 2024—a trend seen across the region and beyond. In Thorold, 11 out of 12 months set new records for active listings, with monthly numbers averaging 60-80% above the 10-year average. This oversupply is not unique to Thorold; as the overall supply continues to improve, the Thorold market is expected to improve as well.
What To Watch For
With so much of the Thorold market driven by investors, the larger market trends—particularly those in the GTA—will significantly impact Thorold’s performance in 2025. If buyer and market sentiment improves in early 2025, the momentum from late 2024 is likely to continue building into the spring market this year.

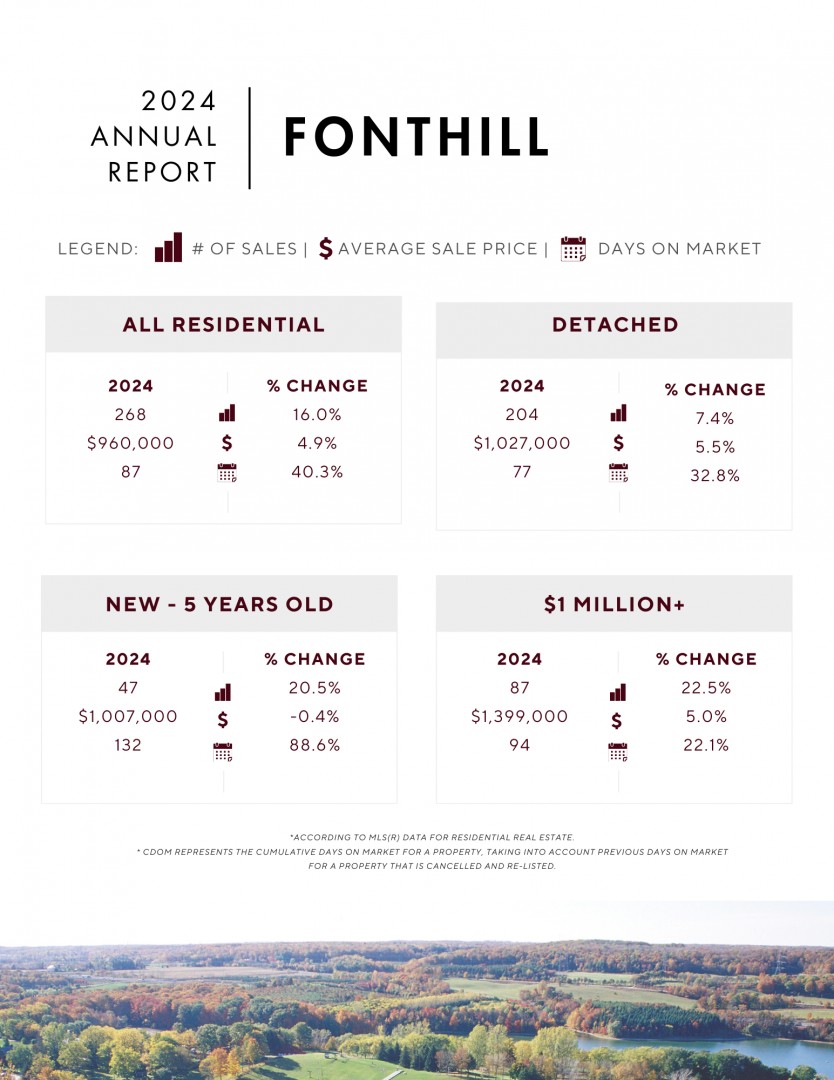
Second Place Finisher
On an annual basis, Pelham produces the second-highest average sale price in the region, ranking only behind Niagara-on-the-Lake. That trend continued in 2024, with Pelham averaging $960,000. While the Niagara Region was flat in 2024 compared to 2023, Pelham was actually up nearly 5% y/y. When the early 2022 price spike is removed, 2024 fared very well in comparison to recent years, up an impressive 28% since 2020.
Monthly Sales
Similar to all of the smaller marketplaces in the region, the monthly sales numbers in Pelham were fairly erratic, with a month-to-month range of -33% to +21% when compared to the 10-year average. With 265 annual sales, that was 8% below the 10-year average of 287. That said, 2024 had the highest annual sales since 2021 and was fairly consistent with the pre-2020 years.
Record Inventory
While conditions improved from 2023, overall market demand in 2024 was still sluggish, which resulted in compounding monthly active inventory. Those totals peaked over the summer, when the monthly totals averaged 80-90% above the 10-year average. A positive sign was the steady decline in active inventory in Q4.
New Construction
With a wide range of new construction underway or in the planning process, new construction will continue to impact the overall market data for Pelham. In 2024, in any given month, there were 40-60 active listings that were new or nearly-new. Meanwhile, sales in that age category averaged four per month. It’s fair to say that builders across the region are eagerly awaiting a rebound in demand.
Million Dollar Market
Approximately one-third of all sales in Fonthill in 2024 were over the $1 million threshold. With 87 sales in total over $1 million, 8 of them were over $2 million. Among all of those beautiful properties, there was no shortage of frustrated sellers, as there were nearly 300 expired or cancelled million-plus listings—almost four times the number of actual sales.
Rural Properties
Part of the obvious allure of Pelham is the abundance of beautiful properties on one acre or more of land. In 2024, there were 30 sales that would fit into that category, with an average sale price of just under $1.5 million. Compare that to 19 sales with an average sale price of $1.2 million in 2023. These figures highlight steady demand for these properties, even in volatile markets.
What To Watch For
With an average sale price of nearly $1 million, the Pelham market will rely on buyers from around the Golden Horseshoe. Keep an eye on those overall supply and demand numbers as we head into the spring market. Ideally, we should see monthly sales in the 30+ range, with available inventory returning to the 125-150 range.

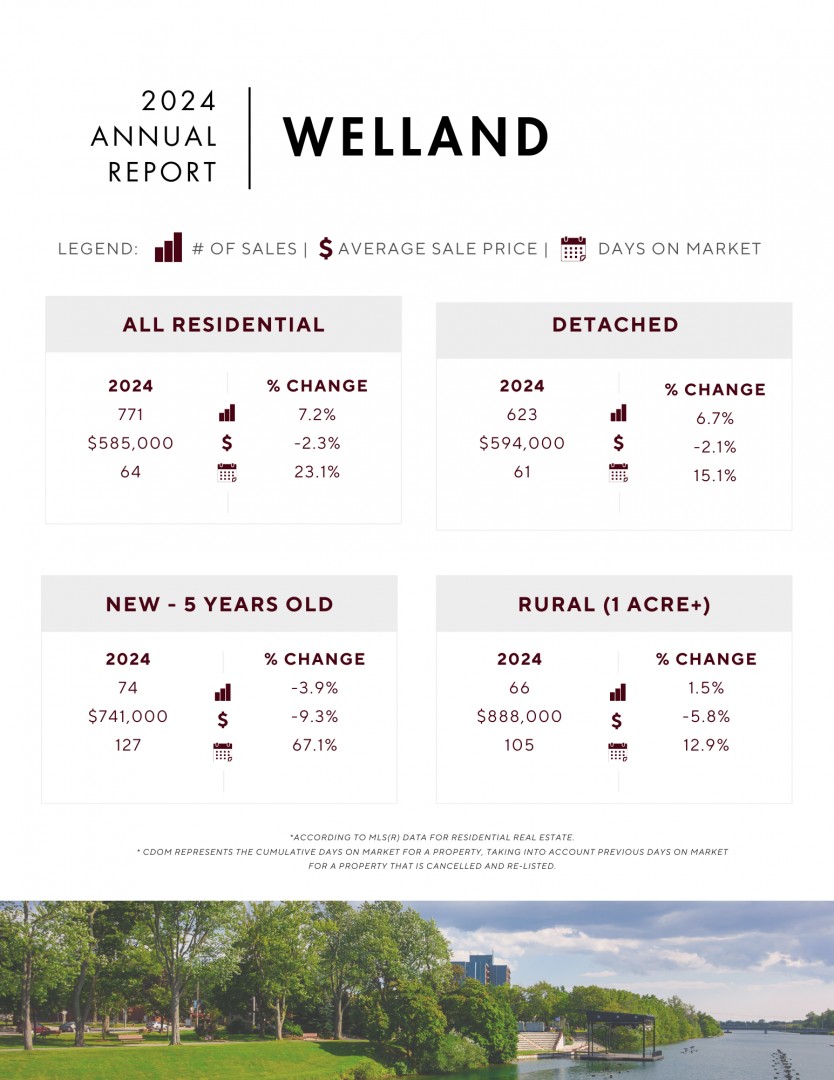
Sales Roller Coaster
The 2024 market in Welland had no shortage of twists and turns when it came to the monthly sales totals. The year began strong, with the first four months just under the 10-year average. Similar to other cities in Niagara, the summer months faltered, with May and June sales coming in 28% and 33% below the 10-year average, respectively.
With 774 total sales, 2024 surpassed 2023 but still ranked as the second-lowest annual sales in the past decade. Despite this, the market showed improvement from Q2 to Q4, providing hope for continued recovery in 2025.
Patient Sellers
With hesitant buyers taking longer to act, the time it took to sell a home in 2024 was longer than in previous years. Homes took an average of 67 days to sell, compared to 34 days in 2022 and just 16 days in 2021—a stark increase reflecting the market volatility in recent years. In any market, but especially when longer days on the market are the norm, setting an accurate asking price is a critical part of the process.
Pricing Trends
After seeing significant price growth of 21.5% in 2020 and 30% in 2021, average sale prices have plateaued over the previous four years. Excluding the spike in early 2022, the average sale price from 2021 through 2024 has settled in between $585,000-598,000.
In 2024, the average residential sale price was $585,000, with detached coming in slightly higher at $594,000—both representing a 56% increase over five years. Although recent price movement has been stagnant, this historic growth is significant.
Record Inventory
All areas of Niagara had record high inventory, but Welland took that to another level. Every month in 2024 set a new record for the number of active listings, with monthly inventory ranging 55-75% above the 10-year average. The highest inventory months were September and October, so it will be interesting to see how this excess supply plays out in early 2025.
Higher-End Caution
On a monthly basis in 2024, there were 20-35 active listings over $1 million dollars in Welland. Buyer demand remained sluggish, with only 20 sales in that price range in all of 2024. As a result, days on the market for those sales were approaching four months on average. As of early 2025, there are 37 active listings over $1 million, a number which is sure to grow as we move into the spring market.
What To Watch For
Along with the rest of the region, the impact of buyers from outside of the region will have an impact on overall market activity. While annual figures in 2024 were underwhelming, the upward trend in monthly sales offers a reason for optimism. Increased demand will help to ease those active listings numbers, decrease the days on the market, and add some fluidity to the marketplace.

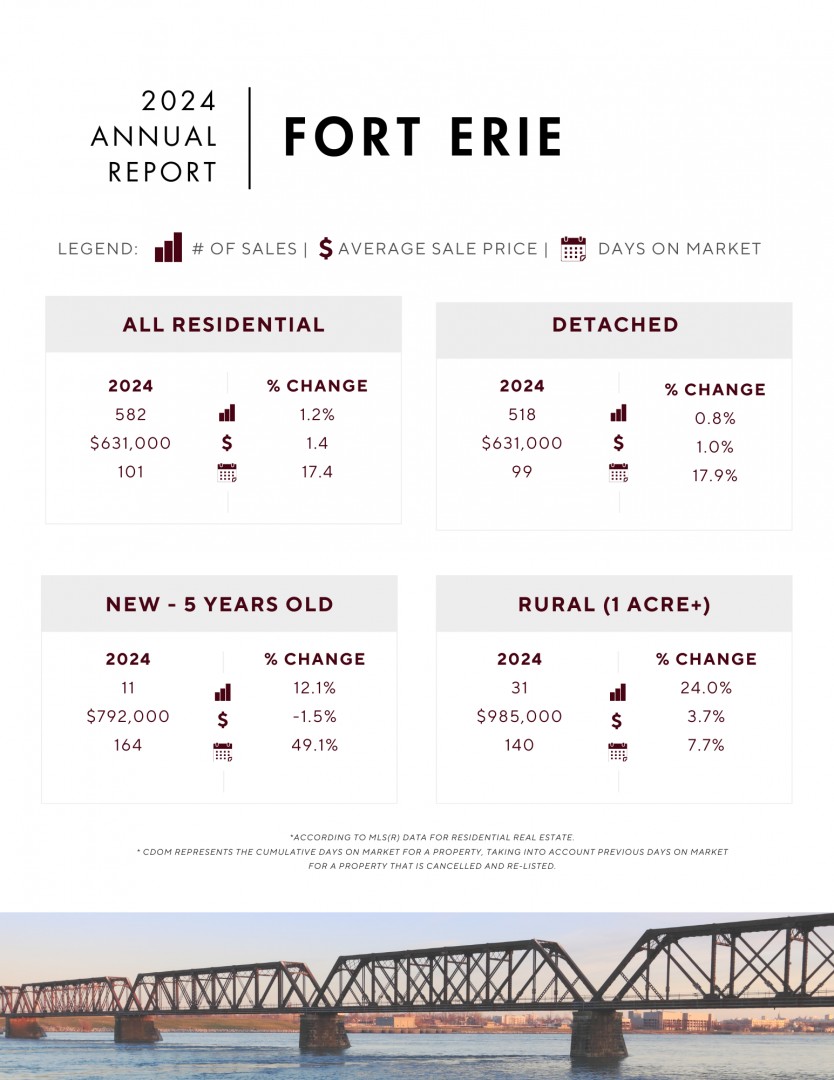
Growth, And Then Some
To say that the Fort Erie area is experiencing growth would be a significant understatement. Take a drive through the area, and you’ll see plenty of new developments either underway or proposed and getting ready to start. There are currently 72 ‘new’ active listings on the MLS system, which account for only a fraction of the total available inventory for sale. It is important to peel back the layers in order to better understand that data.
For Sale Signs
With or without new construction, there was no shortage of inventory in Fort Erie in 2024. Each month in 2024 set a record high for active listings for the respective month when looking back over the past decade. Each month was between 50-75% above the 10-year average with the peak in Q2.
Sale Price Trends
Factoring in the price spike of 2022, even after removing outliers from the data, Fort Erie has still seen massive price gains over the past decade, with four of the ten years producing annual gains of 20% or more. 2023 took a significant step back from 2022 (down 17%), so it was encouraging to see 2024 up from 2023, even if only by a few percent. Despite all the volatility, the average price of a home in 2024 was still up 24% from 2020.
Monthly Sales
The 10-year average for annual sales in Fort Erie was 716, and the only reason it exceeded 700 was due to the very busy years of 2016, 2020, and 2021. The 572 sales in 2024 were almost equal to 2022 and 2023. While Q3 struggled at 33% below the 10-year average, Q4 showed some signs of life, with gradual improvement through the end of the year.
Days On The Market
The annual average days on the market since 2018 in Fort Erie resembles a “V”, with the averages from 2018 to 2020 running in the 60-90 days range. After the low of 34 days in 2021, the average has increased from 50 days in 2022 to 102 days in 2024. While some of those totals are due to the portion of new construction in the data, the speed of the overall market is expected to pick up in 2025.
Waterfront Activity
With low volume, buyer demand is more important to track than sale prices, which can swing in any direction. There were 11 waterfront or waterview sales in 2024, down from 12 in 2023. The average sale price for 2024 was $1.6 million, with properties selling on average in 2.5 months.
What To Watch For
Out-of-town buyers drive the Fort Erie real estate market on an annual basis. From cottage and secondary homes to downsizers looking for bungalows, the 2025 market will be driven by the fluidity of the overall market.

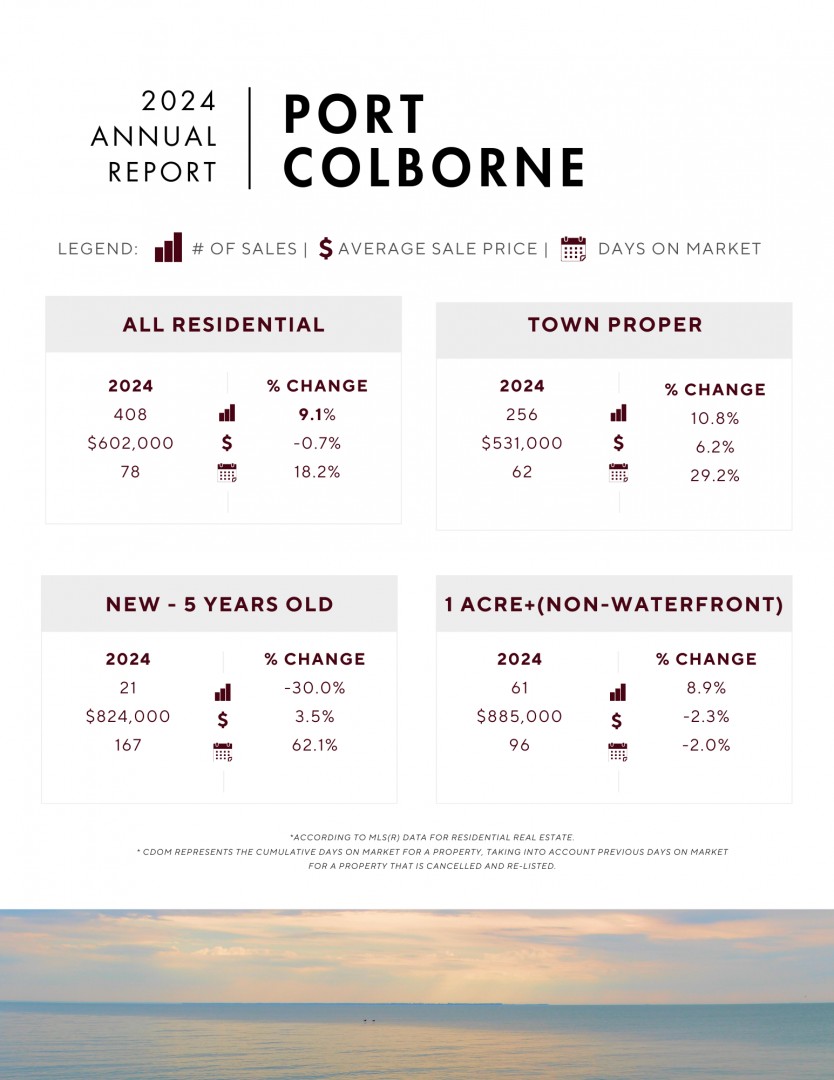
Sales Hanging In There
Over the past decade, the Port Colborne area has had remarkably consistent annual sales, especially when compared to the rest of the region. With just under 400 sales, 2024 came in only 6% below the 10-year average. With that total, the annual sales figures for 2022 through 2024 were within 20 transactions (374-394 per year) of each other. While 2016 and 2021 remain the peak years, total annual sales in 2024 finished very close to the rest of the decade, which generally produced 380-410 sales per year.
Monthly Sales
Volatility was the theme of 2024, with sales bouncing between 40% below and up to 35% above the 10-year average. After a sluggish Q2, the monthly activity stabilized fairly well during the remainder of the year, with the last six months almost equaling the 10-year average.
Supply Imbalance
Sluggish sales and persistent sellers have led to compounding available inventory. As a result, 2024 marked a decade-high record for active listing inventory. Monthly totals were 70-100% higher than the 10-year average. However, that trend began to ease in the last four months of the year—a positive sign for the market.
Sale Price Trends
With low annual volume and a handful of high-value lakefront sales each year, the monthly data for Port Colborne can paint a varied picture. Month-to-month swings ranged from +33% to -15%, with the highest monthly averages happening in Q4. Because of these fluctuations, while the average in 2024 was the lowest since 2020, it was still up nearly 20% since then.
New Construction
Similar to its neighbour to the east, Port Colborne has seen a fair amount of new construction underway. While new builds accounted for 10-15% of the active listing inventory in 2024, they only accounted for 2-3% of the sales. Buyer demand for new construction is driven by out-of-market buyer activity, which is something we hope to see improve in 2025.
The Search For Space
A consistent source of demand in rural Niagara is homes on an acre or two. Whether it’s locals looking for some space or GTA buyers looking for a complete change of pace, the demand for acreage has been strong over the past several years. In rural Port Colborne, there were 29 sales in 2024, with an average sale price of $1.044 million (excluding waterfront). With a few less sales than 2023, the average sale price was essentially unchanged.
What To Watch For
With the high-water mark of 513 sales in 2021, a more reasonable expectation for 2025 is a sales total somewhere in the low 400s, which would match the 10-year average. Similar to the rest of the region, the market is patiently waiting for improved sentiment, otherwise known as buyer confidence. Once that overall activity returns, the Port Colborne market will show some improvement.
WHAT TO DO WITH THIS INFO
When selling a home, there are five key variables to consider:
· Price – the asking price in relation to the market
· Presentation – how well the home is showcased
· Marketing – the quality of the overall promotion
· Location – a fixed variable that cannot be changed
· Terms – the terms and conditions a seller may need
The information in this report has, hopefully, provided you with valuable insight into the all-important first variable: pricing.
While it is impossible to predict the future, current trends combined with past market activity can often shed light on what to expect.
“History doesn’t repeat itself, but it often rhymes.”
-Mark Twain
After a whiplash-inducing few years here in Niagara, we are looking ahead to 2025 as a year where overall market dynamics might stabilize and continue moving toward more normal conditions.
If you are considering a move or simply looking to gain a better understanding of your property’s value, we are here to help you at any time.