
THE END OF AN ERA
Consider this blog an ode to an old friend. In this case, that old friend is my Google spreadsheet, jam-packed with 22 years of market data for the Niagara real estate market. As someone who has tracked our local market data for 20+ years, I find myself in the middle of a not-going-as-planned transition to a new MLS system, one which will now provide a different set of data.
The quick backstory:
The Niagara Association of Realtors (NAR) was born in 2002. NAR was a combination of all the municipalities across the region joining into one association, sharing all resources, systems, and data.
Fast forward to the end of 2024 and early 2025, and while NAR still exists, we are in the middle of a transition to a new MLS provider. This new organization, under the umbrella of PropTx, is now sharing data not only with NAR but other associations, including the Toronto Regional Real Estate Board, representing a total of over 80,000 Realtors.
Previously, the house in Thorold that was listed by a Toronto Realtor was not automatically in the NAR data. While it was not a great system—something that we had been pushing for improvements to for several years—it was the system we had. Now, with this new arrangement, that house in Thorold is included in our data. As a result, the data going forward will be different—marking the end of an era and the beginning of the next.
This blog is simply a tribute, a space to recognize and look back on 22 years of the Niagara real estate market data as we knew it.
…cue the music…
THE EARLY YEARS: Smooth sailing...
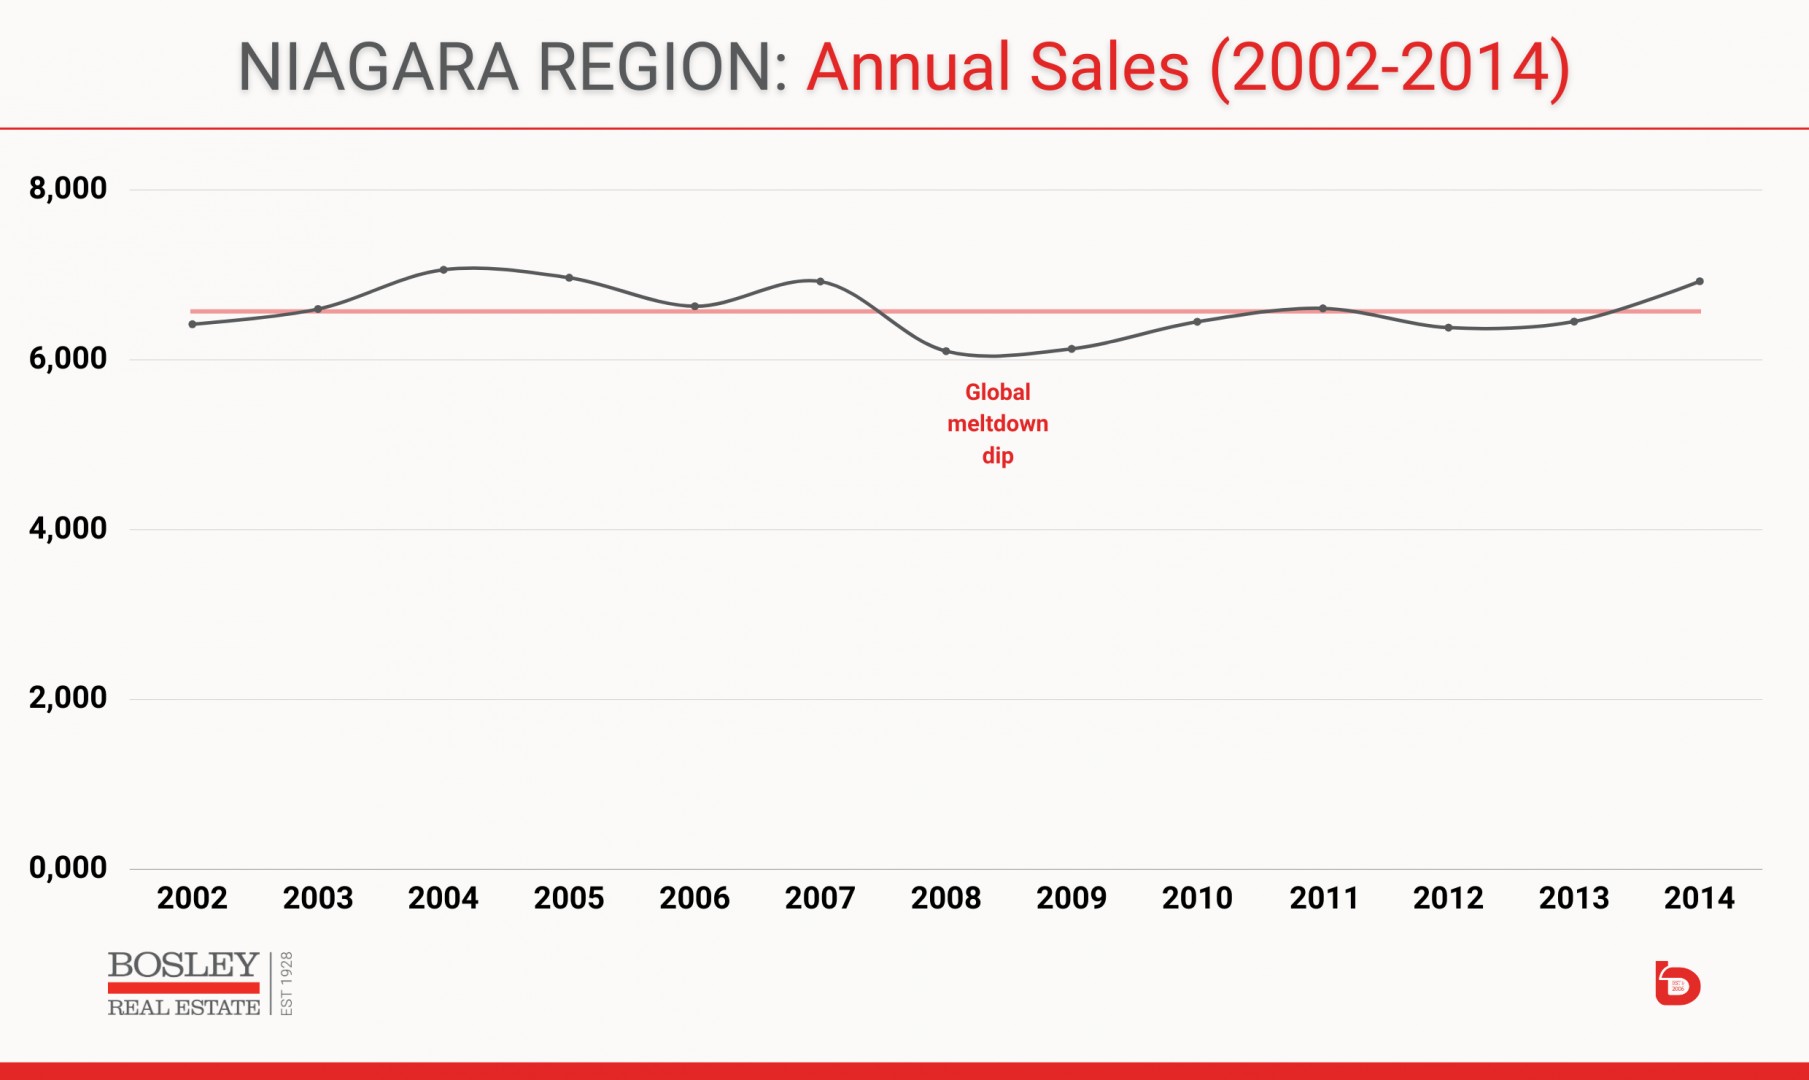
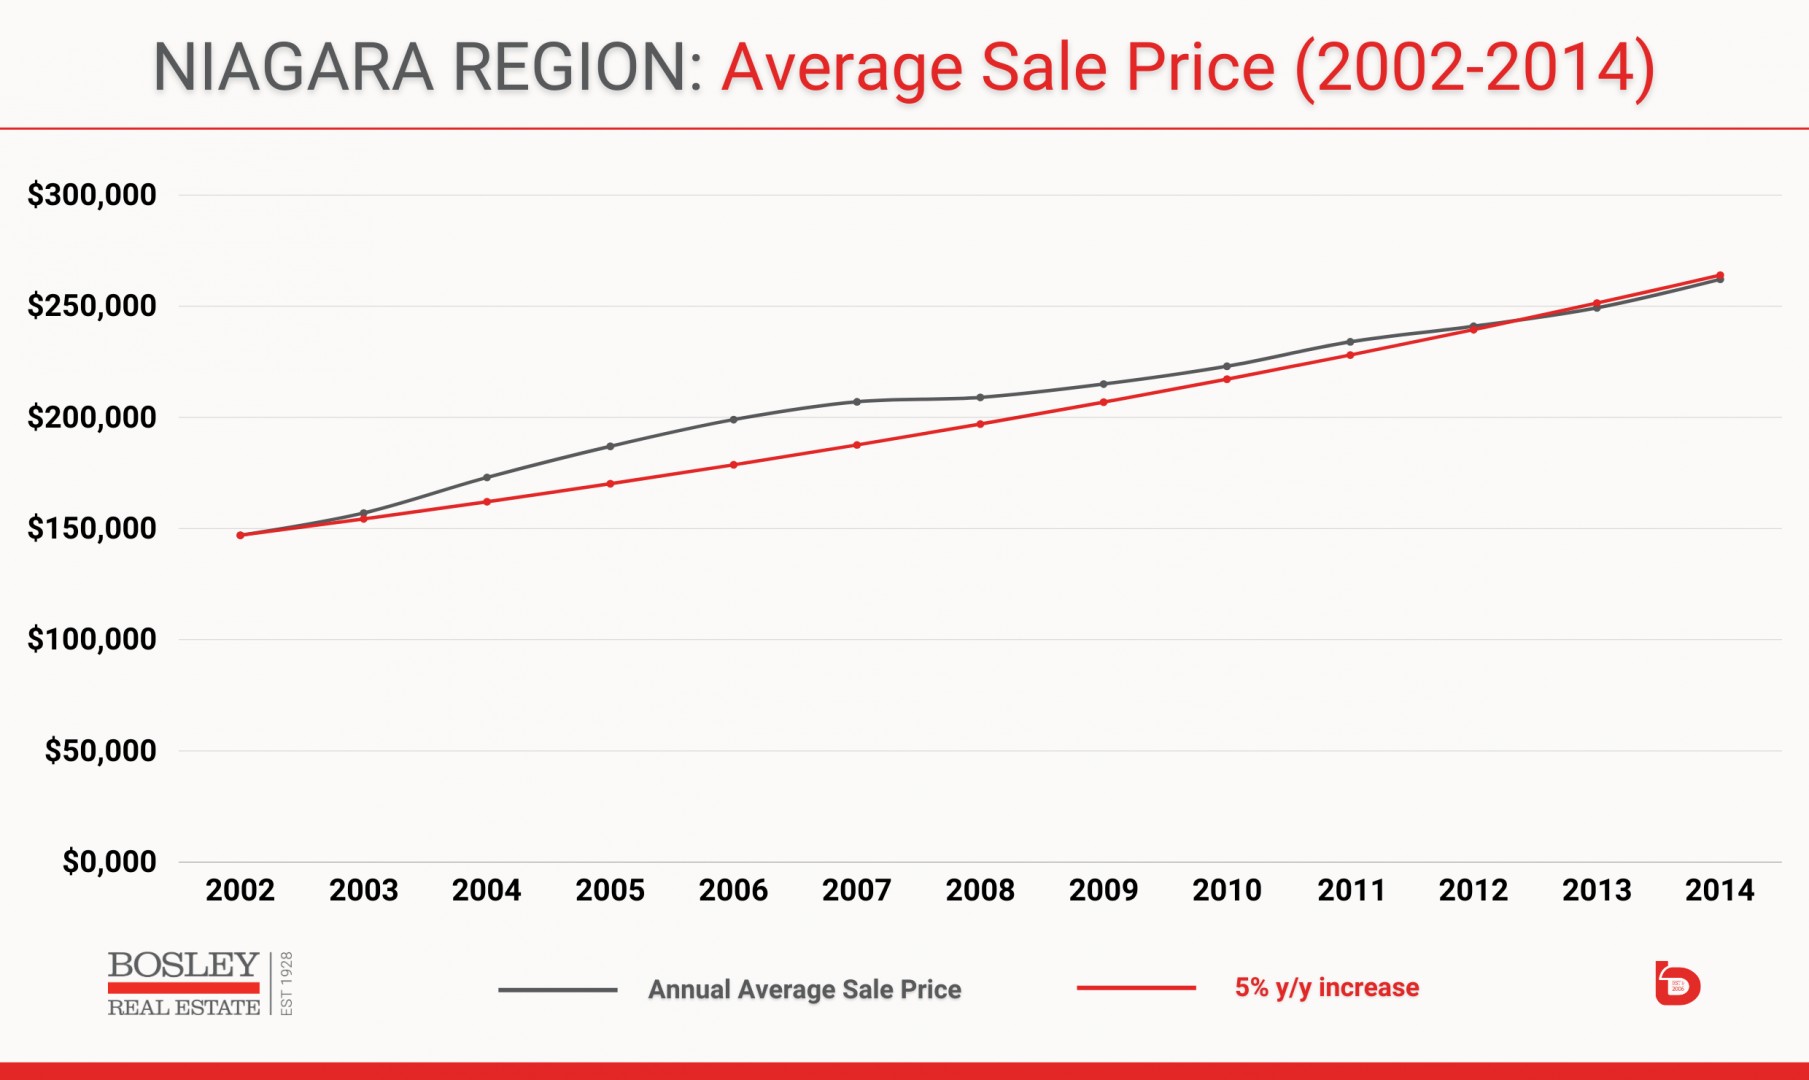
From 2002 through 2015, the NAR market produced fairly calm waters. Annual sales were generally in the 6,500 range, with the average sale price increasing by an average of 5% per year.
Yes, we felt the fallout of the global meltdown in 2008, with the annual sales decreasing by 12% compared to 2007. The average sale price fell at the beginning of 2008 but made up ground to finish the year up 1% over 2007. That was a big win at the time since our annual average sale price remained in the positives until the rough 2023 market showed up. More on that later.
But aside from that turbulence in 2008, the local market was notably boring from 2002 through 2015, at which point the Captain asked us all to put on our seatbelts and return our chairs to the upright position. A turbulent, wild ride was about to begin.
This graph shows you the annual sales in those relatively calm, boring years. The red line represents the average annual number over those particular years. For us Realtors who were working in Niagara back in 2004 and 2005, we remember those years well. After fairly unremarkable year-over-year data, they were the first years to see annual sales reach the 7,000 range.
As a further example of smooth sailing, below you'll see the annual average sale price trend for the region. The grey line shows the annual average sale price, while the red line represents an annualized growth rate of 5% year-over-year. The annual increases of 7-10% in the early years slowed temporarily after the 2008 crisis, but as you can see, while price improvements slowed, they never went into negative year-over-year territory.
THE MIDDLE YEARS: Turbulence
After the relative predictability of the previous years, 2015 into 2016 was when we all sensed things were about to change—and fast.
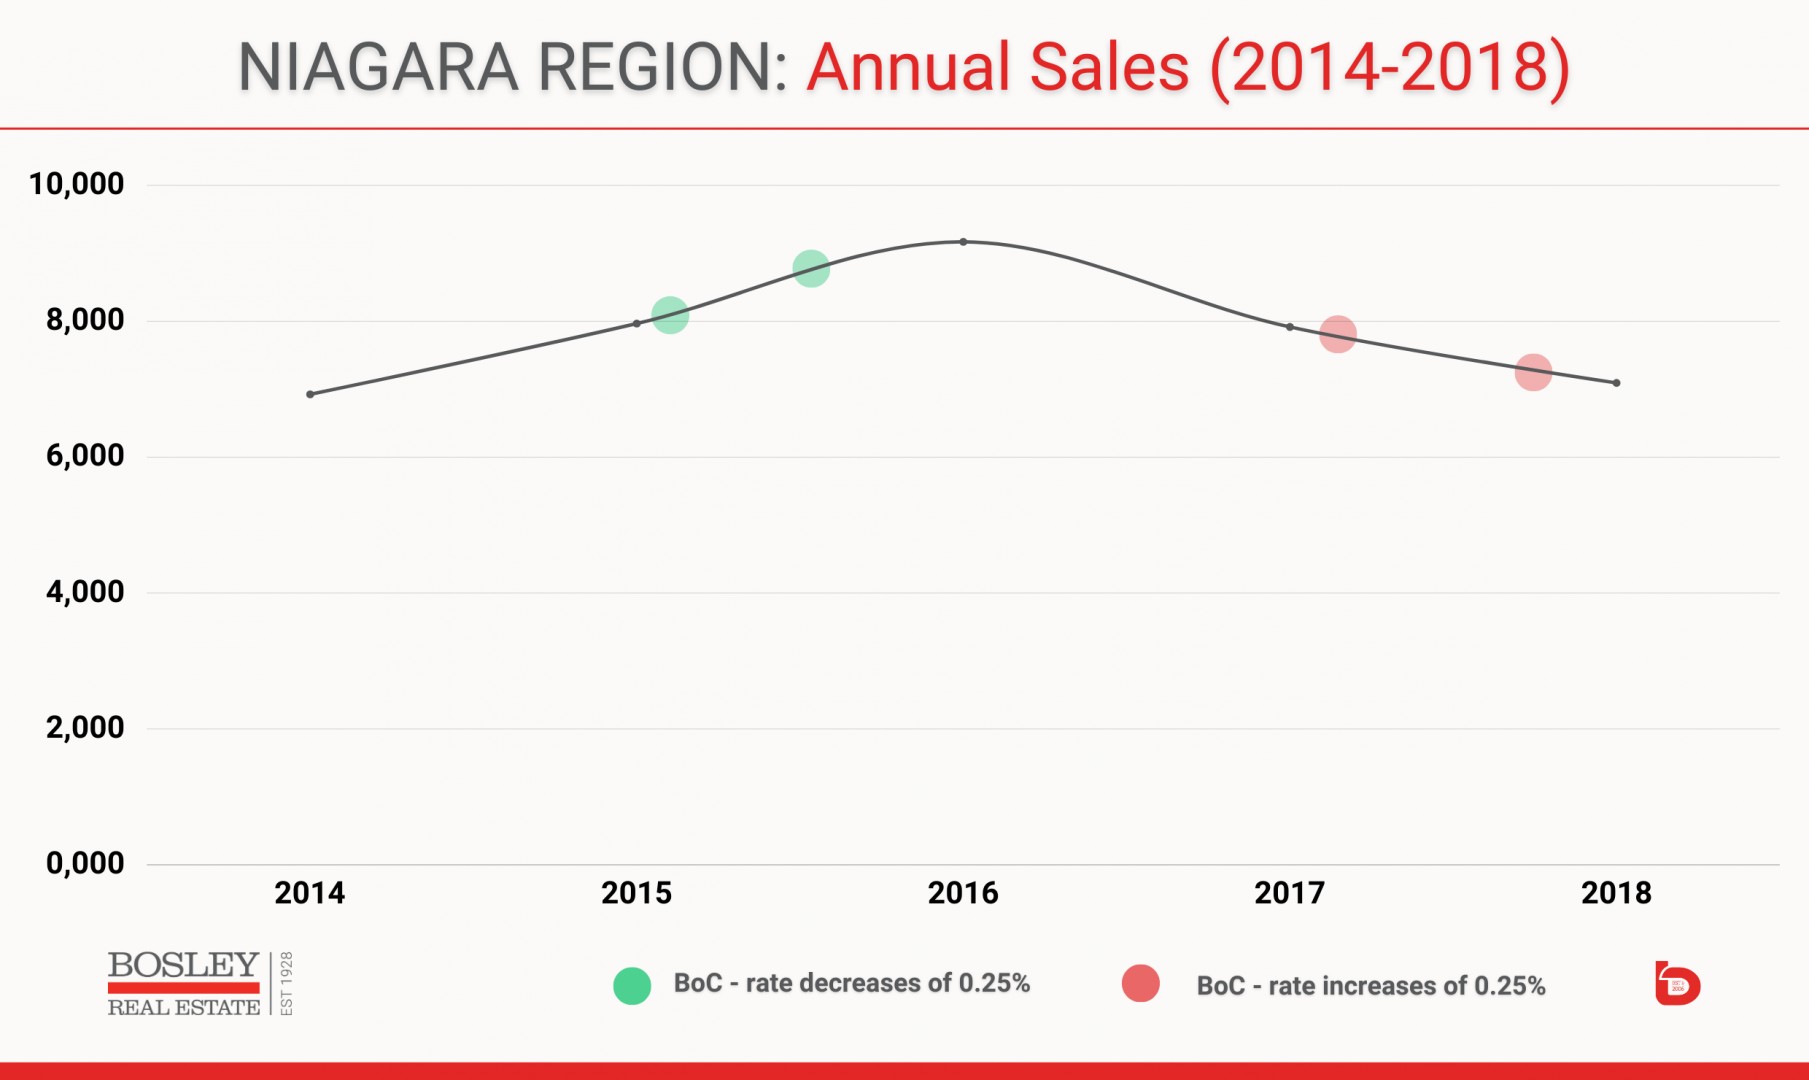
With annual average sales in the 6,500 range since 2002, overall demand took off to new levels, with annual sales in 2015 nearly hitting 8,000 and 2016 topping a new high-water mark of 9,170 sales. While sales took off, so too did the average sale price, which rose by 27% from 2014 to 2016. That type of growth was previously unheard of.
What was happening?
It was a combination of factors, but the big, glaring elephant in the room was the arrival of the out-of-town buyer. Whether they were non-resident investors, GTA downsizers or buyers from who-knows-where, the Niagara sellers loved them, while the local buyers found this new landscape far less friendly than they remembered.
With our prices in the $300,000 range, we were easy pickings for the sell-high, buy-less-high crowd. Combine that with a low Bank of Canada overnight rate, and it was a perfect storm.
In terms of sales, this five-year chapter was a turtle-back market. Look no further than the next graph showing annual sales from 2014 through 2018. With sales up 32% in two years, the new rules started to arrive, which you can see, stymied overall demand levels.
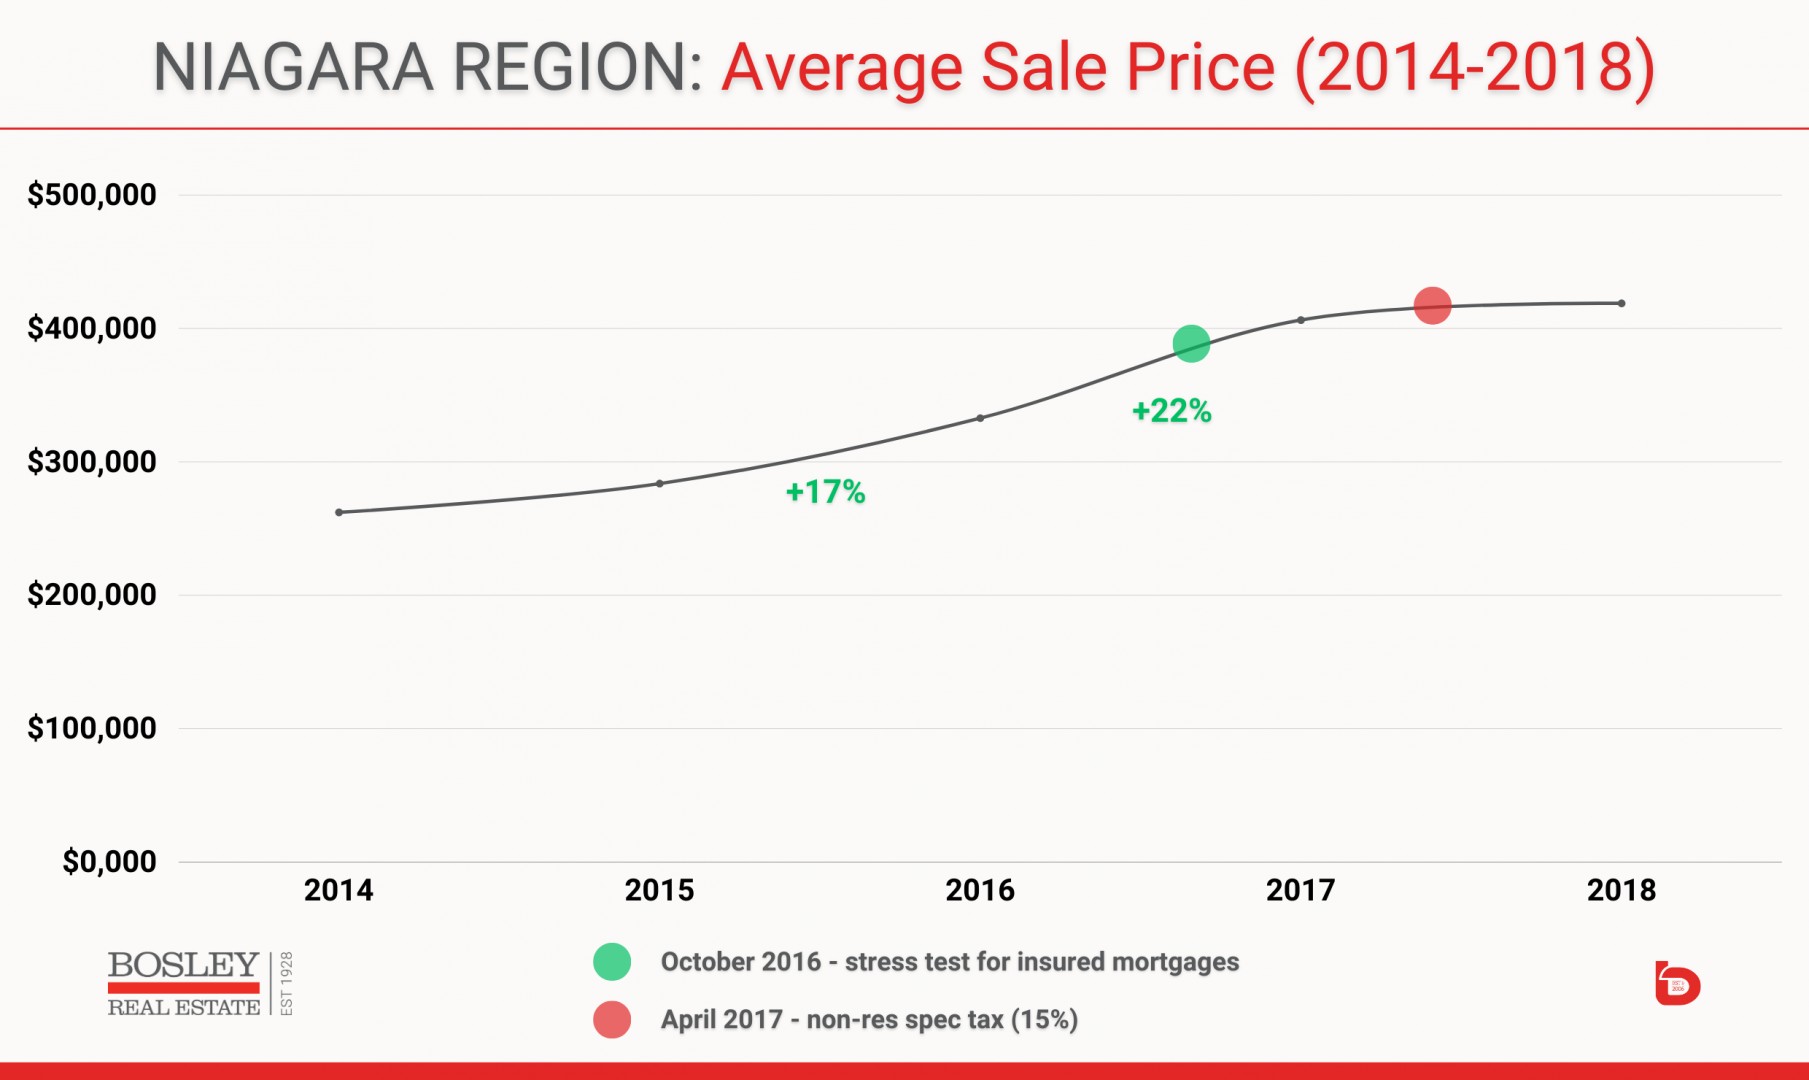
The green dots show the overnight rate changes, with the Bank of Canada lowering rates twice in 2015 and then raising them twice in 2017. Along with that, we saw the introduction of the stress test in 2016, as well as the non-resident speculation tax in Q2 2017. The impact of those changes on sales was immediate, with the impact on pricing lagging behind.
The seismic shift in average sale prices during this first dose of turbulence was really a case of shock and awe. Remember, the average sale price was up a whopping 25% from 2006 to 2013. Then suddenly, here we are in 2018, with the average sale price leaping 43% in two years.
The lagging impact of the 2016/2017 rule changes was finally felt in 2018, when prices were up a more typical 3% year-over-year. Still, the arrival of the out-of-town, gun-slingin’, multiple-offer-making, over-asking buyer was here to stay.
THE FINAL CHAPTER: A Hurricane
After two Bank of Canada (BoC) overnight rate increases in 2017, there were three to follow in 2018, bringing the overnight rate from 0.5% in June of 2017 to 1.75% by the fall market in 2018. With no new rules, and an overnight rate that was held through 2019, we saw the market engine start to warm up again. Sales in 2019 were up 9% year-over-year, with the average sale price up 9% to $459,000.
That relative moderation was to be short-lived, as 2020 and the COVID pandemic arrived, turning everything, including the real estate market, upside down.
Sales in early 2020 were put on ice, as we were temporarily stunned. With three Bank of Canada rate cuts in March 2020, the overnight rate dropped to a mouth-watering 0.25%. Combine that with prices still relatively under-valued, and the second half of 2020 turned into one of, if not the, strangest real estate markets we’ll ever see.
With masks, rubber gloves, and sanitizer in hand, the market exploded as a very complicated fear of missing out took hold.
How outrageous was the COVID market? Here are a few of the records that were set, and still stand today:
- Lowest monthly sales for any month, all-time: April with 292 sales.
- The last six months of 2020 and the first five months of 2021 (11 months in a row) set all-time sales record highs for their respective months.
- The average sale price jumped 54.5% from 2019 to 2021.
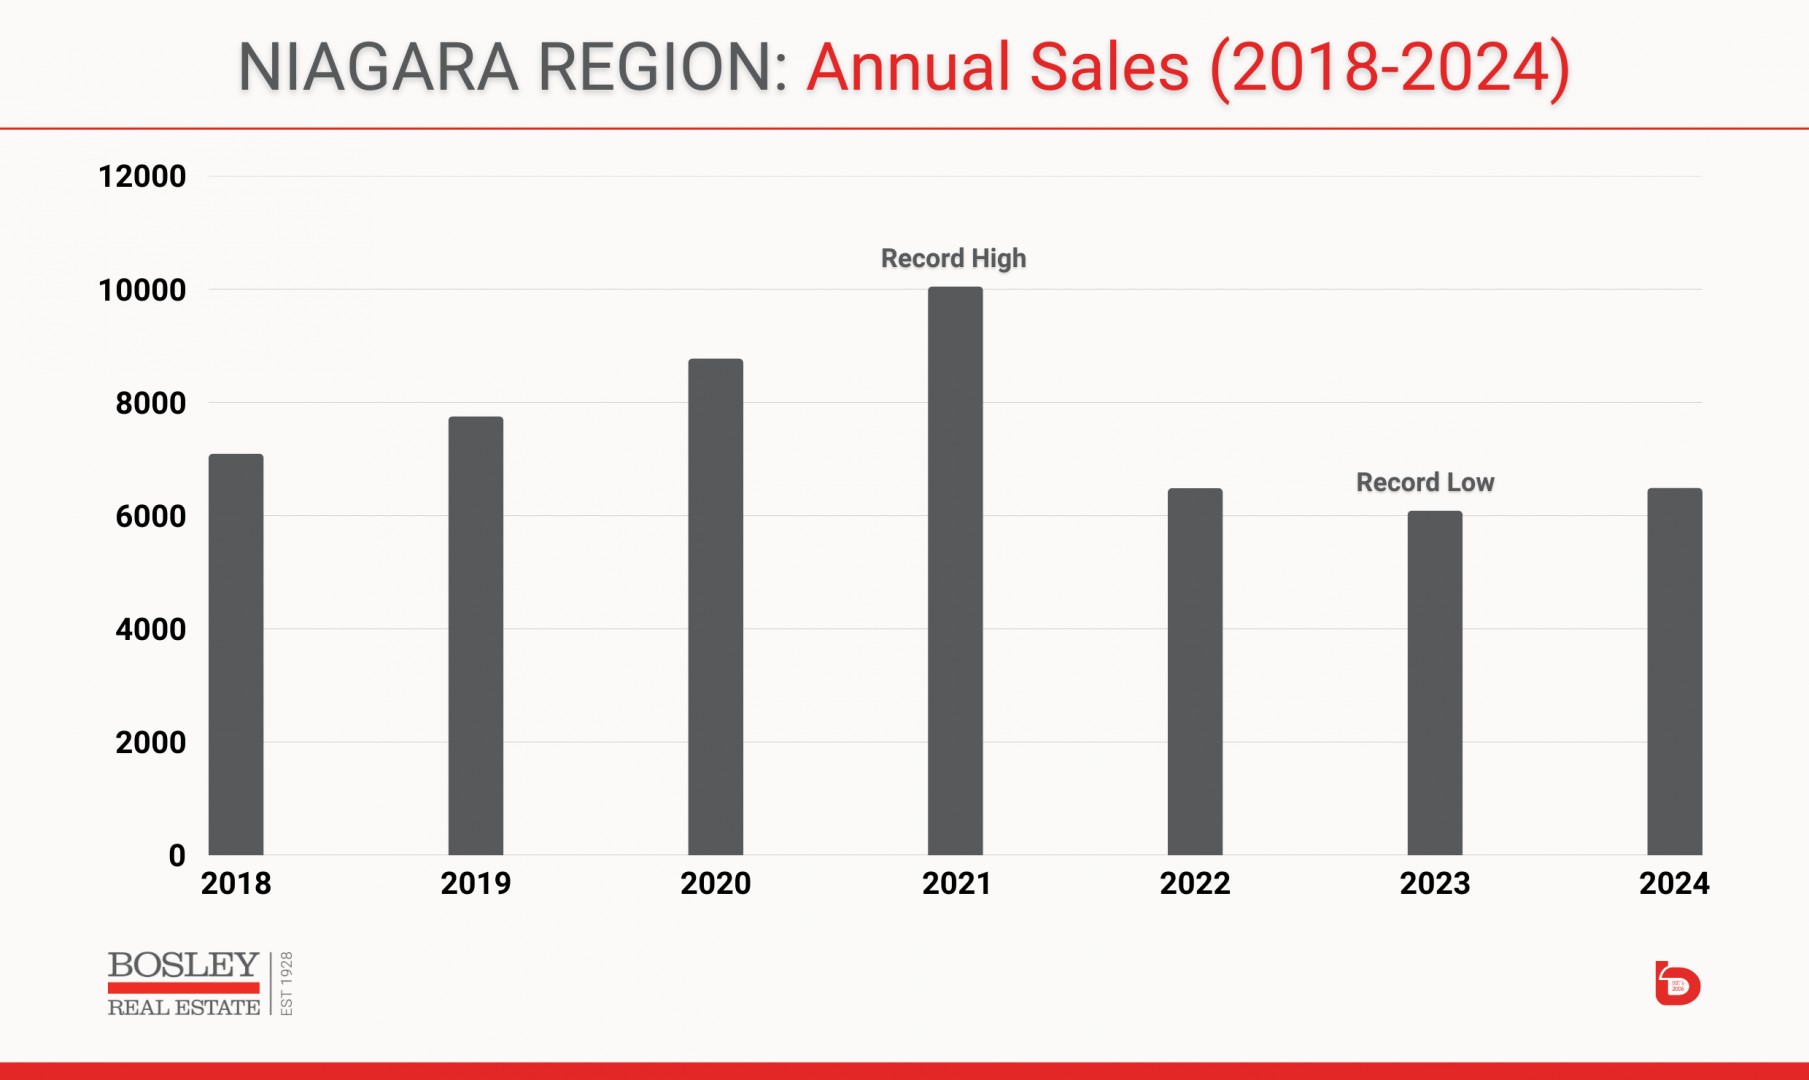
- 2021 set an all-time record high for annual sales, with 10,049. The previous high was 9,170 in 2016.
- Days on market (time it takes to sell) fell to record lows.
- The average sale price jumped by +/- $100,000 from December 2021 to January 2022, only to drop by nearly that amount 90 days later. That amount in one month was also unheard of.
Here is a graph showing the sales trends over these historically remarkable years. With sales escalating by 10-15% from 2018 leading up to the epic 2021, you can clearly see the instant and profound impact that the Bank of Canada overnight rate increases had on the following three years:
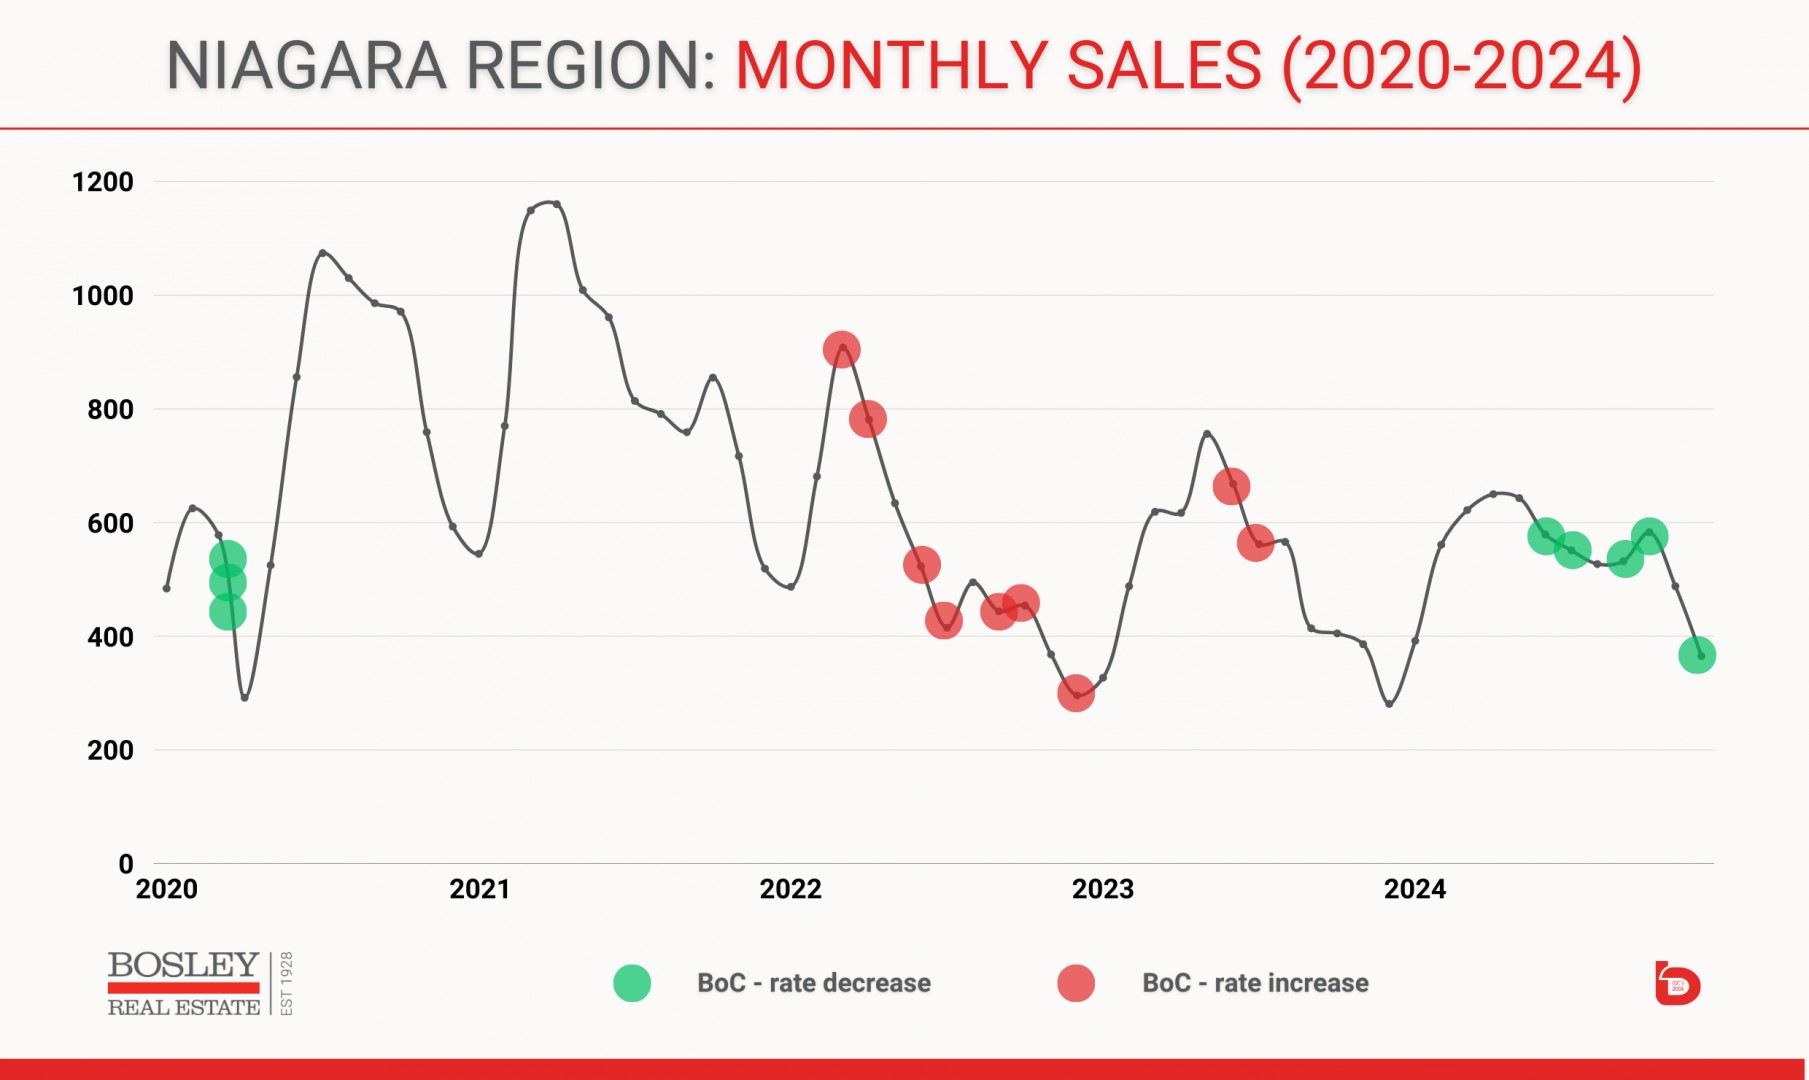
This next graph shows the monthly sales trends along with red dots representing BoC rate increases, and green dots representing rate decreases. The big thinkers in the room, namely the Canadian Real Estate Association, are forecasting an increase of 8.6% for sales in 2025. While 2022-2024 produced 6,000-6,500 sales, that forecasted year-over-year bump of 8.6% would bring Niagara back into the range of the 10-year average in 2025, which would be a notch above 7,000 sales.
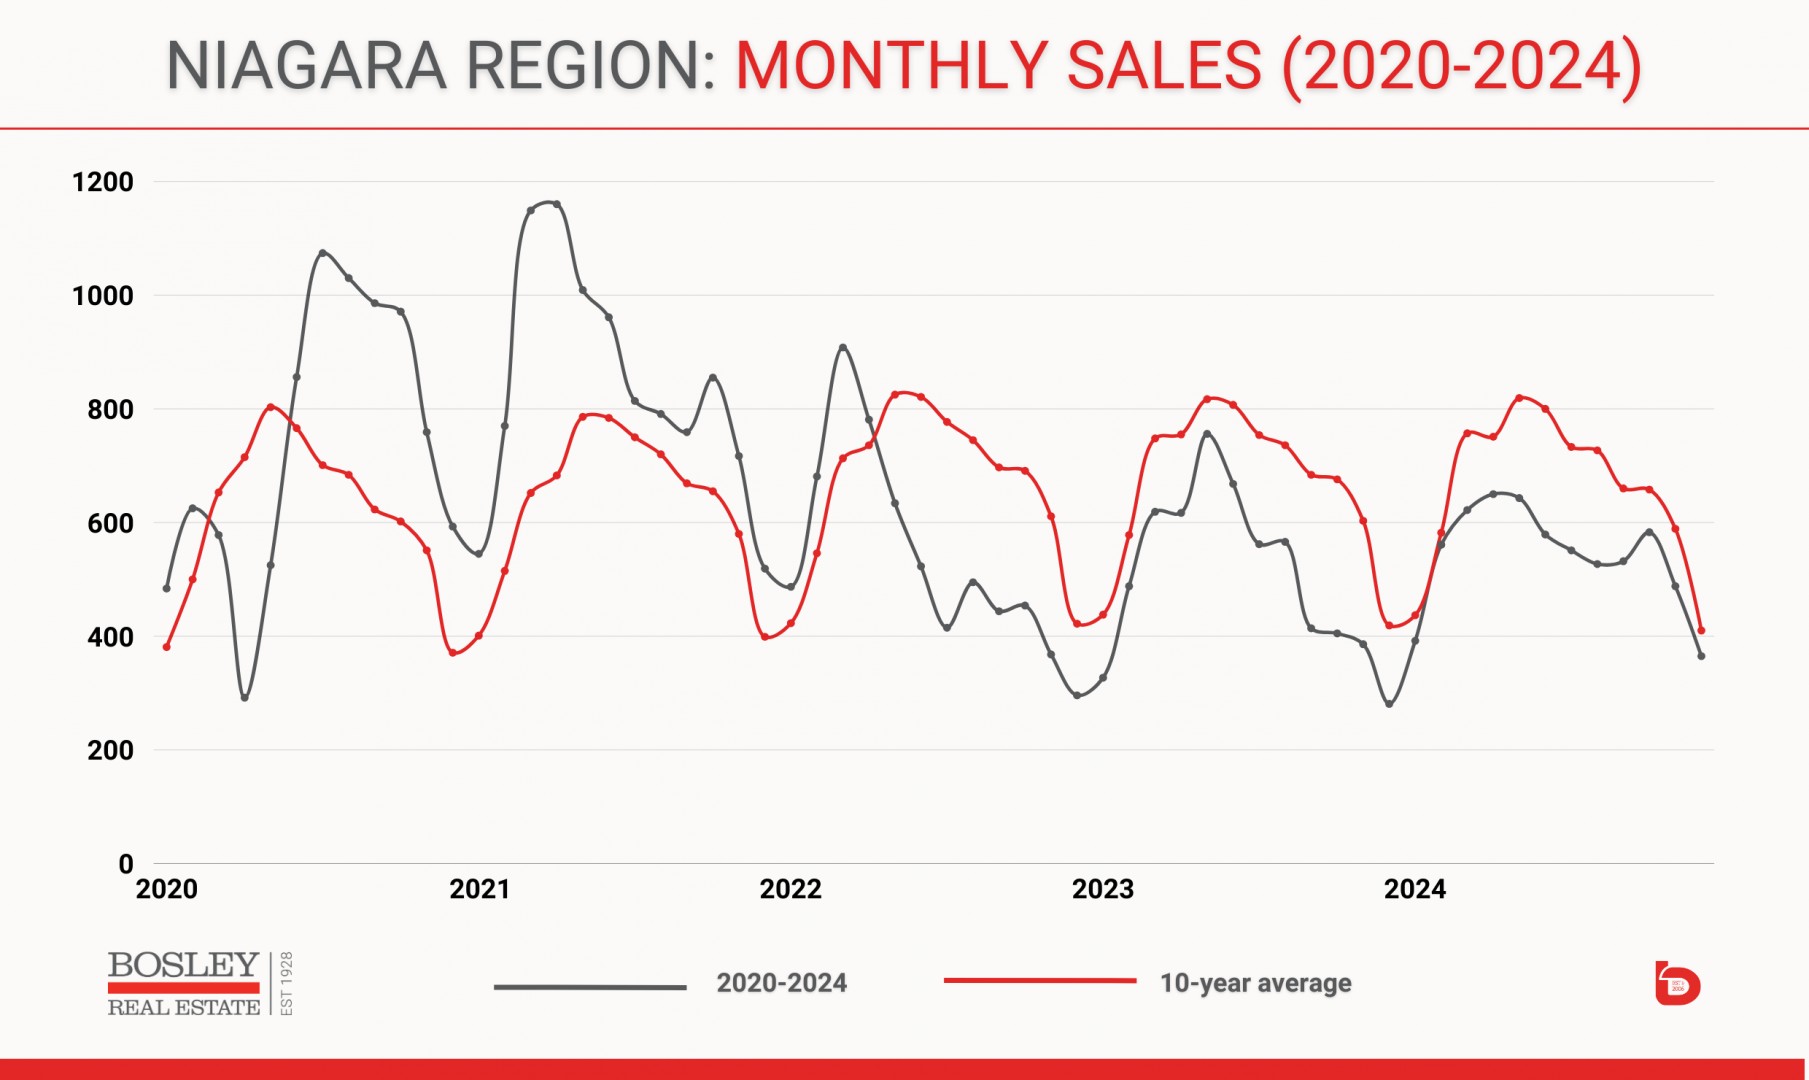
To give some context regarding how the past five years have performed in relation to the previous 10-year average, this graph shows you just that. The grey line represents 2020-2024, while the red line represents the 10-year average. Note the absolute reversal that sales experienced in early 2020 versus the balance of that year. Then came the electric record-setting 2021, where some months were nearly double the 10-year average, followed by a period of full-speed, no-hands-on-the-steering-wheel growth into 2022. That market mayhem was snuffed out in the spring of 2022 when the BoC started raising rates, and monthly sales remained consistently well below the 10-year average over the next few years.
"Supply and demand is great and all, but what's my home worth?"
Afterall, that is the question that most want answered. So, how did all of that volatility in demand impact our average sale prices? Needless to say, it was a wild ride. Those ultra-low rates led to a massive appreciation in prices. In fact, the average price of a home in Niagara went from $459,000 in 2019 to $784,000 in early 2022. Of the many records set during this time period, the 27.7% leap in average sale price from 2020 to 2021 is probably the most remarkable. That price jumped up again in early 2022, with an astonishing $100,000 jump from December 2021 to January 2022.
That high-water mark in early 2022 can be seen in the graph below. Q1 2022 had an average sale price of $861,000, which clearly caught the attention of everyone, not least of which was the Bank of Canada. With seven interest rate increases in 2022, the overnight rate went from 0.25% in January to 4.25% by December. The result is the black-diamond ski-hill descent you see in the graph below.
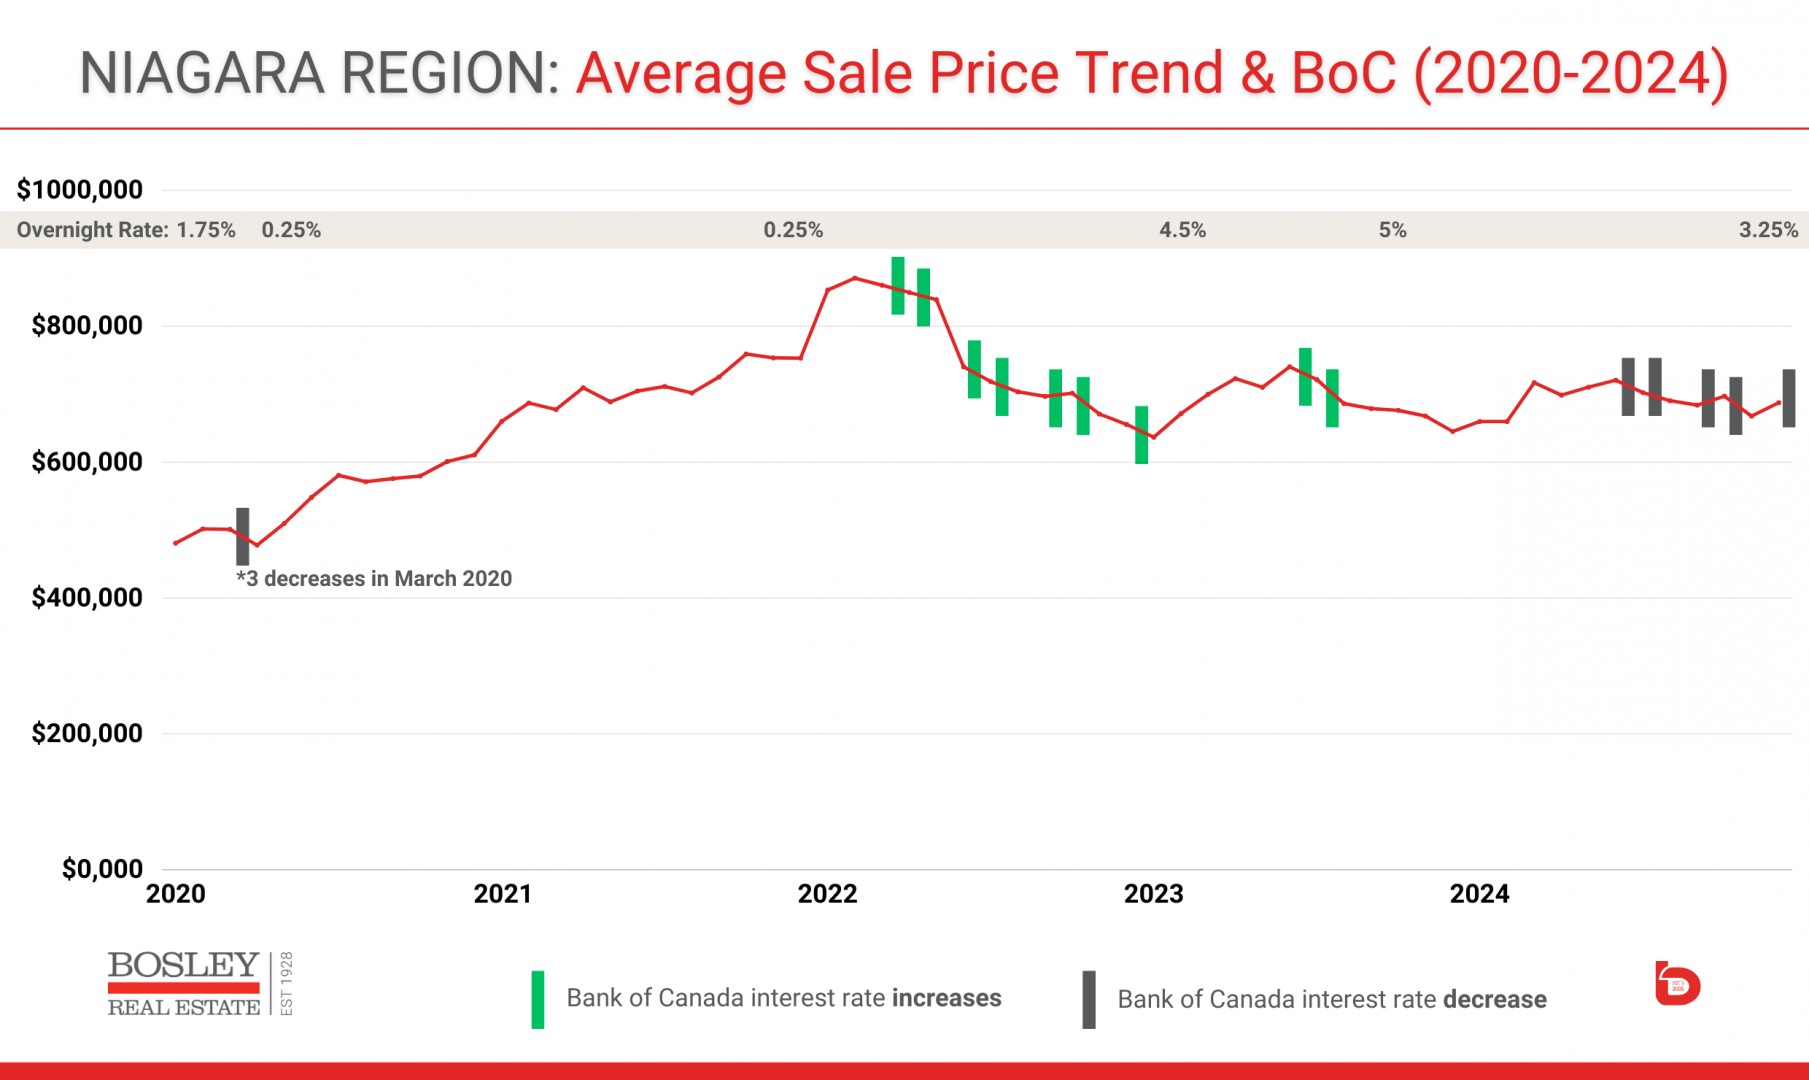
As remarkable as that price growth was, the 30 months from summer 2022 through 2024 were really a time of relative stagnation. Aside from a brief period of vigour in spring 2023, the annual numbers were very similar. In fact, the average sale price for Niagara in the second half of 2022, the annual average for 2023, and the annual average for 2024 were within a few thousand dollars of each other.
- First half of 2022: $836,000
- Second half of 2022: $691,100
- 2023 annual: $695,400
- 2024 annual: $694,700
What is the takeaway from that?
Considering we slogged through record-low demand (sales), coupled with sustained market uncertainty, the fact that the average sale prices held as well as they did is certainly noteworthy.
In fact, the second half of 2024 had just over 3,000 sales, which were up 23% from 2022 and up 16% from 2023.
While 2024 lagged behind historic norms, it was still a marked improvement over 2023.
As an example, sales in Q4 2023 were 30-40% below the 10-year average, while Q4 2024 showed improvements, coming in only 10-15% below the 10-year average. By any calculation, that was a solid step in the right direction compared to where we were.
TO SUM UP.
How do we sum up 2024? No market exists in isolation, and 2024 certainly did not. If we look at the arc of overall activity over the past 5-8 years, 2023 was a fallout year, while 2024 was an attempt at regrouping. While 2024 struggled in the context of what is normal, it was a year that showed some improvement over a very weak 2023.
As we head into 2025, there is no shortage of external threats to this newfound improvement. Amongst the unknowns is the Bank of Canada's interest rate regime, the impacts of the new American political landscape, and of course, the global goings-on. Perhaps that uncertainty is what has defined these turbulent hurricane markets. As we head into the next few years, it remains to be seen if the dust will continue to settle or if we'll hit another patch of turbulence.
Our expectation is that we'll see continued modest improvements in monthly sales—it can't get worse, right?—with that renewed demand resulting in a gentle push upward in the average sale price.
No matter how it is sliced, if you have found keeping track of the 2024 real estate market dizzying, rest assured, you're not alone. Perhaps the one thing that we'd all love to see in 2025 and beyond is a return to greater predictability.
If you'd like to chat about your home, or the market in general, we are here, spreadsheets in hand, ready to chat.
