

...but it's slowly feeling better.
There’s this thing that happens when you have the flu. You’re sick as a dog and can’t imagine what it feels like to feel normal again. The headaches and chills, sore throat and lethargy are relentless. But then suddenly, you wake up and you can see the light at the end of the influenza tunnel.
You’re starting to feel better. But then, this weird thing happens where you just can’t shake it. Energy levels are not quite there, and food still doesn’t taste quite right. The lagging effect is like a dessert you didn’t want after a meal you had no interest in ordering.
And that, in a very roundabout way, describes the Niagara real estate market so far here in 2024.
The last half of 2023 was the flu. Listings were piling on at record levels while monthly sales retreated to a meager 30 – 40% below the 10-year average. Prices decreased every month from June through December. The market did not feel very well at all.
NEW YEAR, NEW MARKET!
The January reset can typically bring with it hopes of a new market. After the Bank of Canada overnight rate hike marathon, we were all eager to see the future rate drops that so many talked about.
Optimism was afoot as sales start to show real progress. After September-December 2023 came in 31–39% below the 10-year average, January and February 2024 were off to an exciting start at only 8% and 1%, respectively, below the 10-year average.
WE WERE BACK!
Along with that return in sales strength, we suddenly had average, median and the HPI benchmark sale prices all increasing again! We were finally starting to feel like ourselves. There was still the odd headache or sneezing fit, but we were functioning and on the right track.
UH OH…
Just as we were back up and moving, we started feeling feverish and lethargic again. Rather than listening to our doctor, mother and Google, we started doing too much, and in March and April, we started paying the price.
New listing inventory skyrocketed from 2,000 early in the year to over 2,600 in April. Remember sales being 8% and 1% below the 10-year average in January and February? Suddenly we were dragging again, with sales running 15 – 20% below the 10-year average.
Call in sick for work and break out the slippers and bathrobe. We’re back on the couch trying to figure out what went wrong.
Here is where things took a twist…
IN SPITE OF ALL OF THAT
While new listing inventory piled on and sales dragged their feet, there were those in the market who were willing to act when they saw value that made sense.
That price growth in January and February continued into March, April, May and June, with growth overall in the average, median and HPI sales prices.
In fact, for the Niagara Region in 2024 (from January to June), we have seen prices do this:
- Average sale price up 9.2%
- Median sale price up 6.3%
- HPI Benchmark sale price up 5.5%
Not bad, considering supply and demand went in opposite directions.
THERE IS MORE TO THIS STORY
Of course, there is. We could pull the market apart in all directions while trying to make sense of the volatility. It really comes down to buyers and sellers and how they’re feeling.
Are they confident? Are they nervous? Confused? Resigned to their fate?
It will depend on who you ask. There are a few indicators though that are noteworthy. With listings at 50% higher than normal, there aren’t enough buyers in the market to level that teeter-totter out.
With 54% of all offers being conditional on the buyer selling their own home, the market mindset is conservative at the moment. Afterall, this is not the type of market to take risks in.
HELP PLEASE
As in similar market bounce backs, we will need an external event to pump confidence into the marketplace. Will future Bank of Canada cuts help? Absolutely. Will they have the market off the couch and running a half marathon a few weeks later? No. It will take some time for the inventory to figure itself out while buyers regain their ability to jump.
And don’t forget, there are approximately 1,500 homes for sale that are owner-occupied. How many of them will become able buyers once they sell?
Inventory easing back, buyers regaining some confidence, and suddenly the bloodwork and lab results of the market still start to look better.
IF YOU LIKE CHARTS, THIS NEXT PART IS FOR YOU:
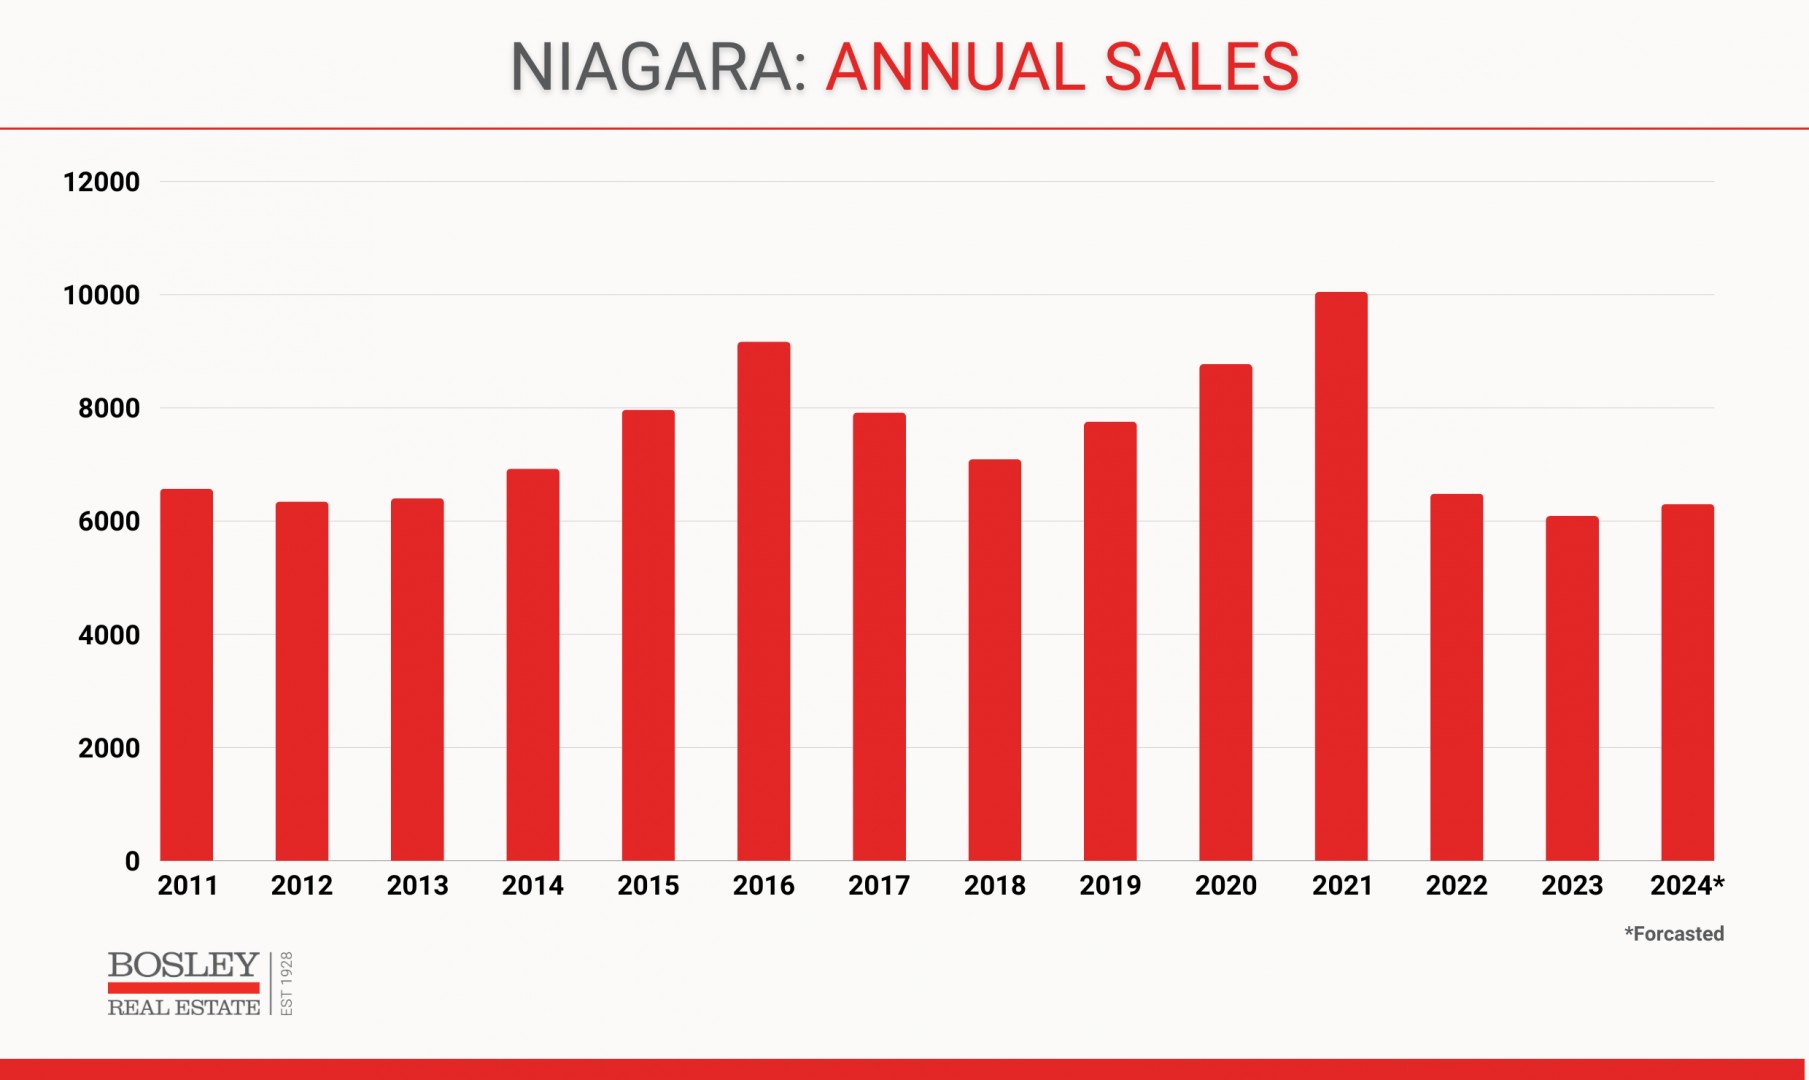
Annual Sales.
This chart is going back to 2011. The final number for 2024 is forecast based on current trends and monthly sales in relation to the 10-year average. 2023 had the lowest annual sales in the last 20 years, so yes, we expect 2024 to beat that, but by only 4-6%.
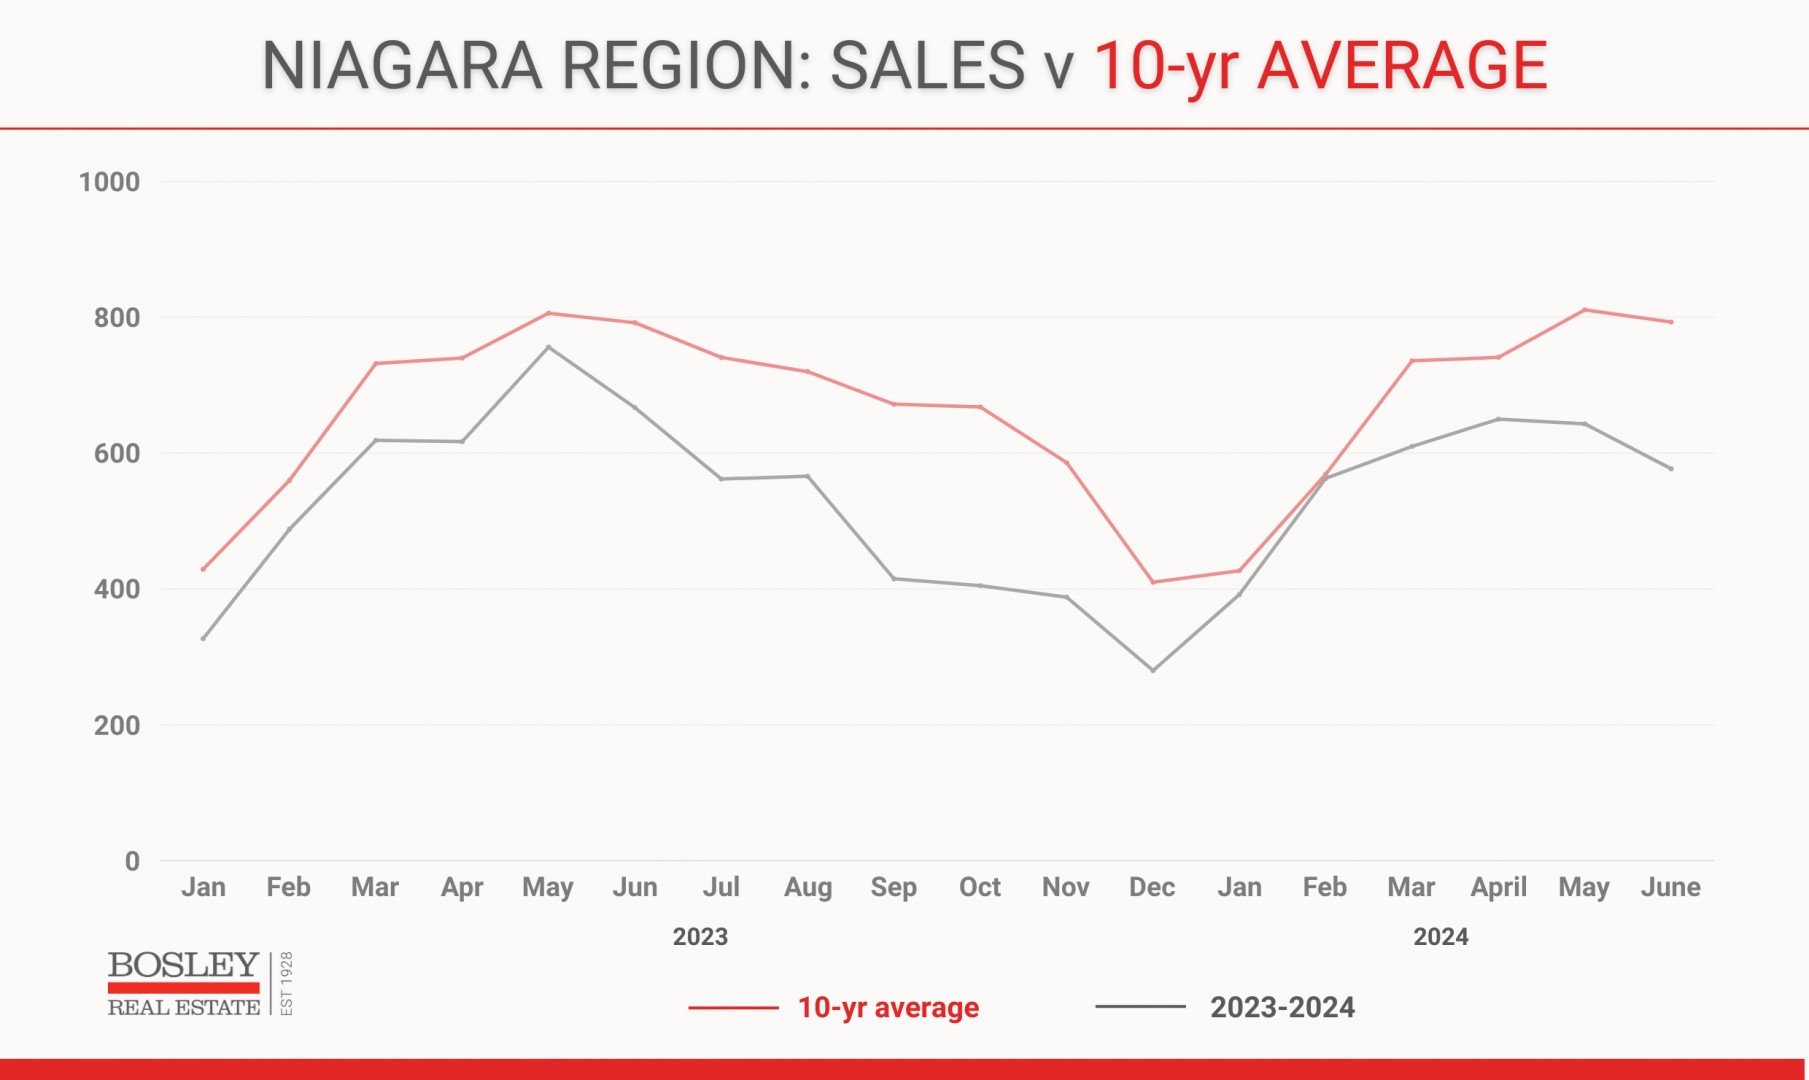
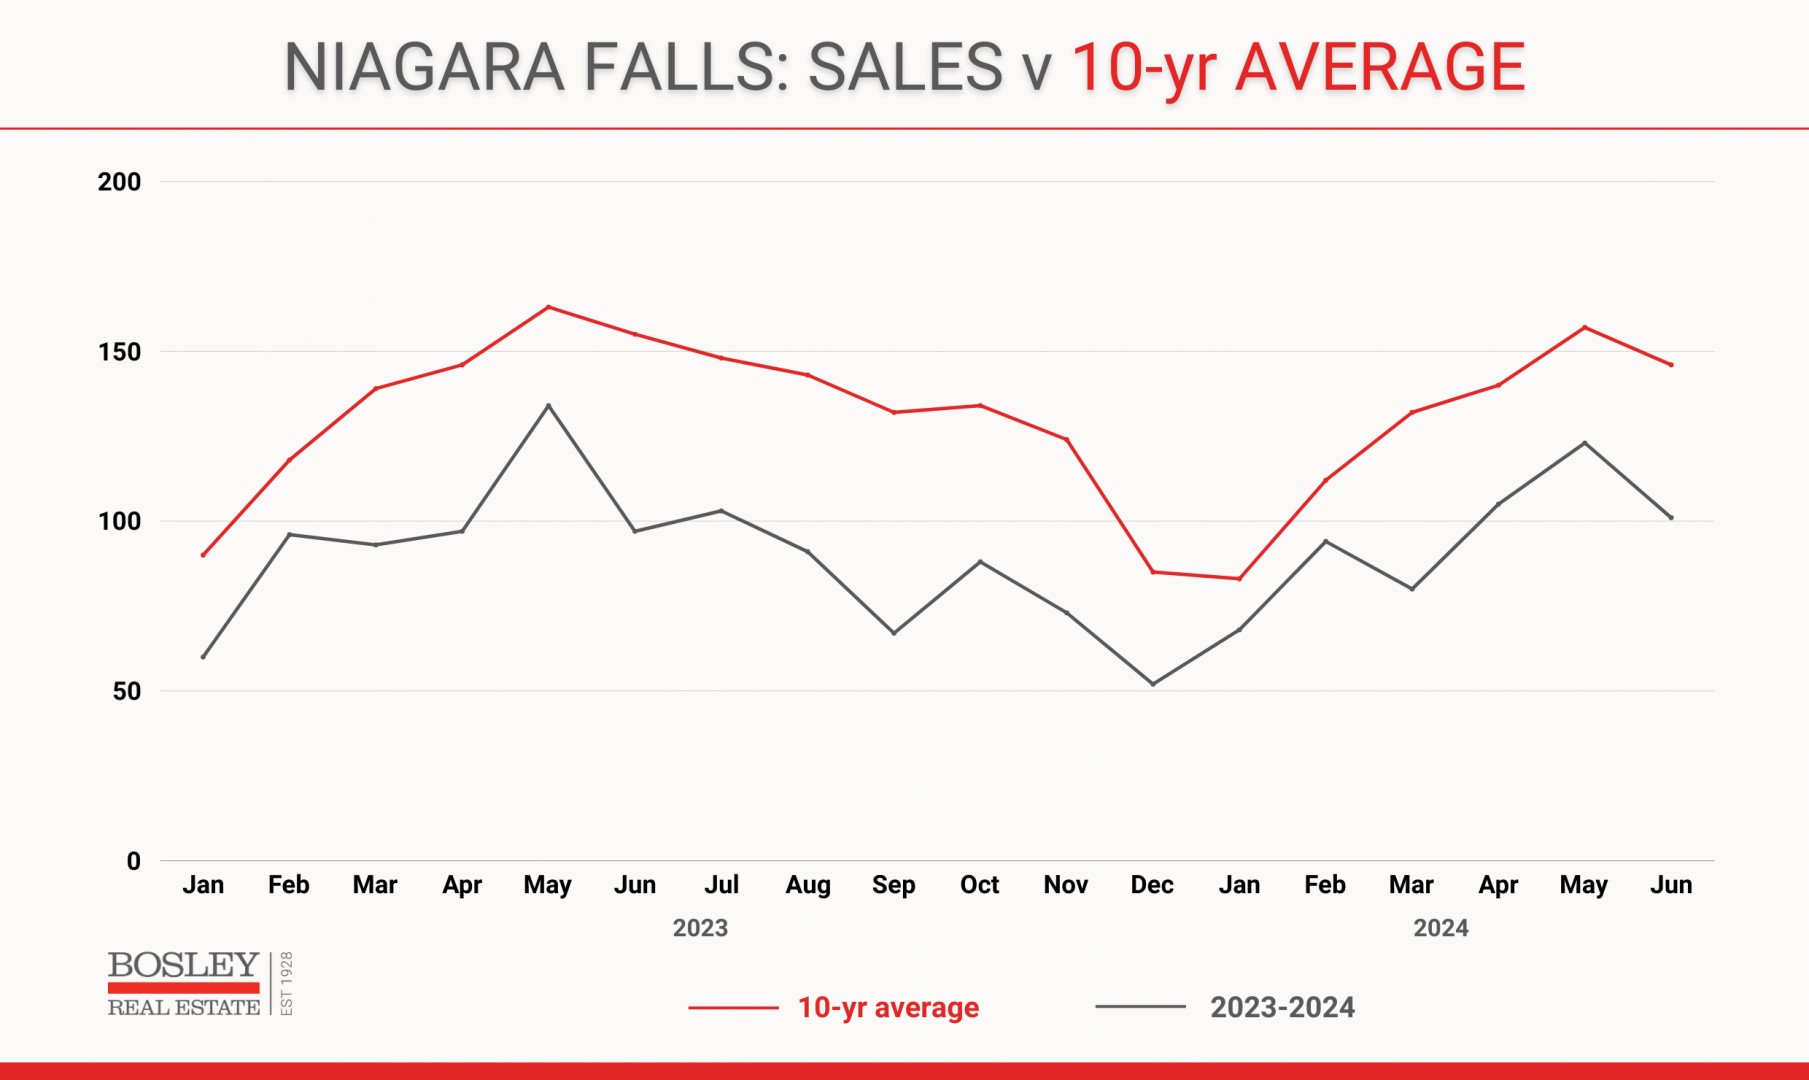
Monthly Sales
Below, you'll see monthly sales from January 2023 through to June 2024. The red line is the 10-year average, while the dark grey line is 2023-2024. You can clearly see the gap in the last half of 2023 with the renewed vigour in 2024. The gap has widened again her in the spring to summer market.
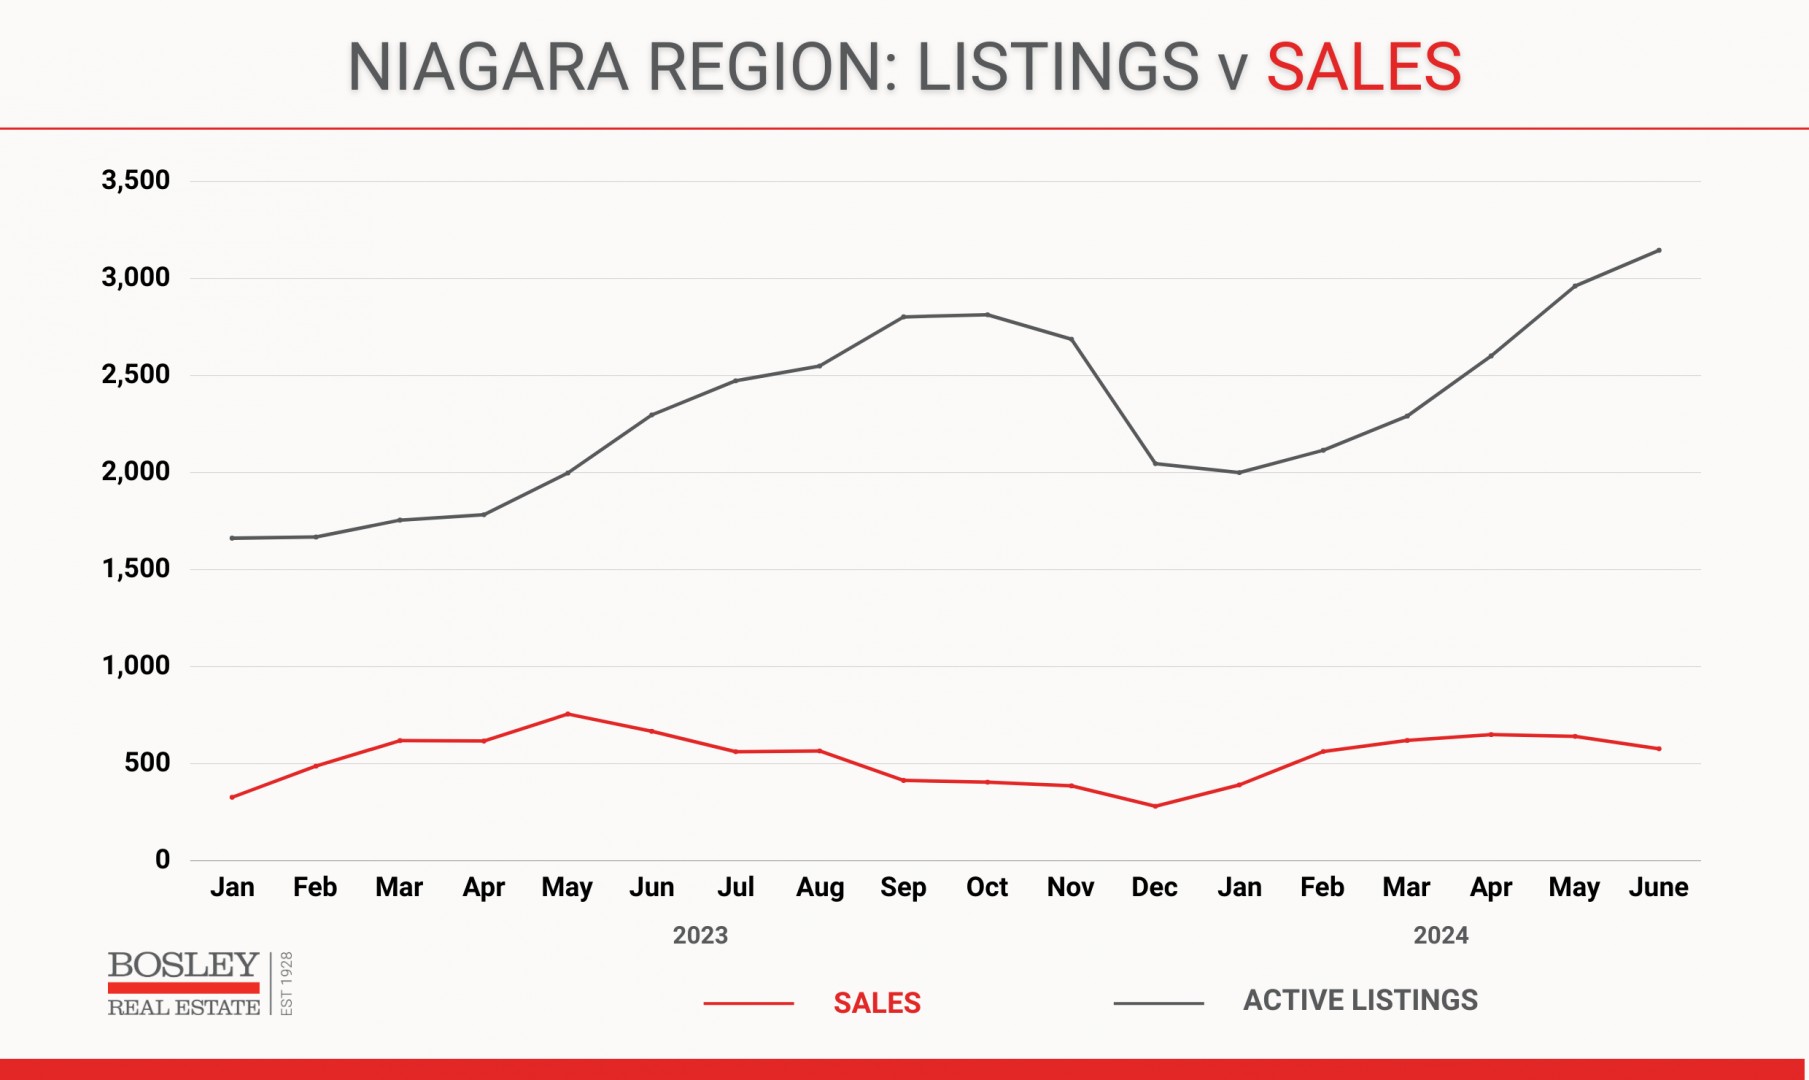
Supply v Demand
The gap between the two lines in the graph below will dictate overall market conditions. Note the widening gap in a very soft second half of 2023. Here in mid-2024, that active listing inventory needs to ease while we also need to see buyers of all stripes, return to the table with confidence.
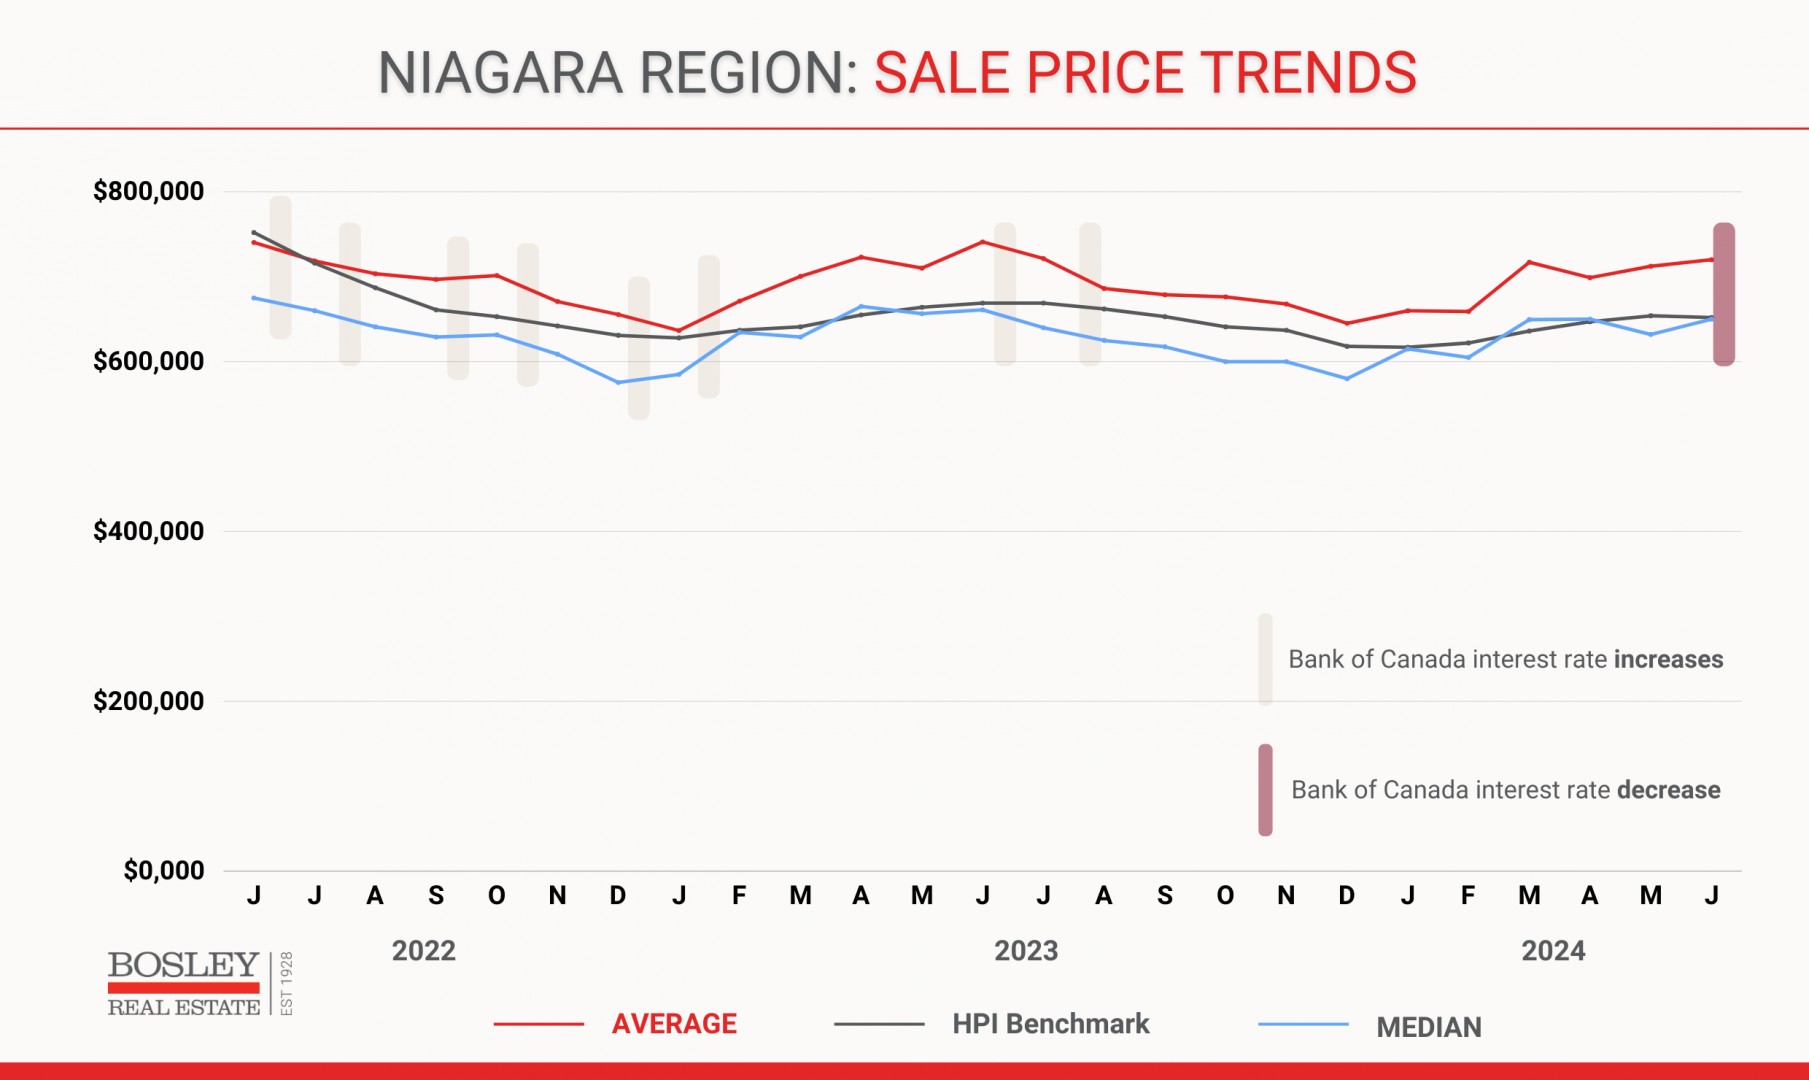
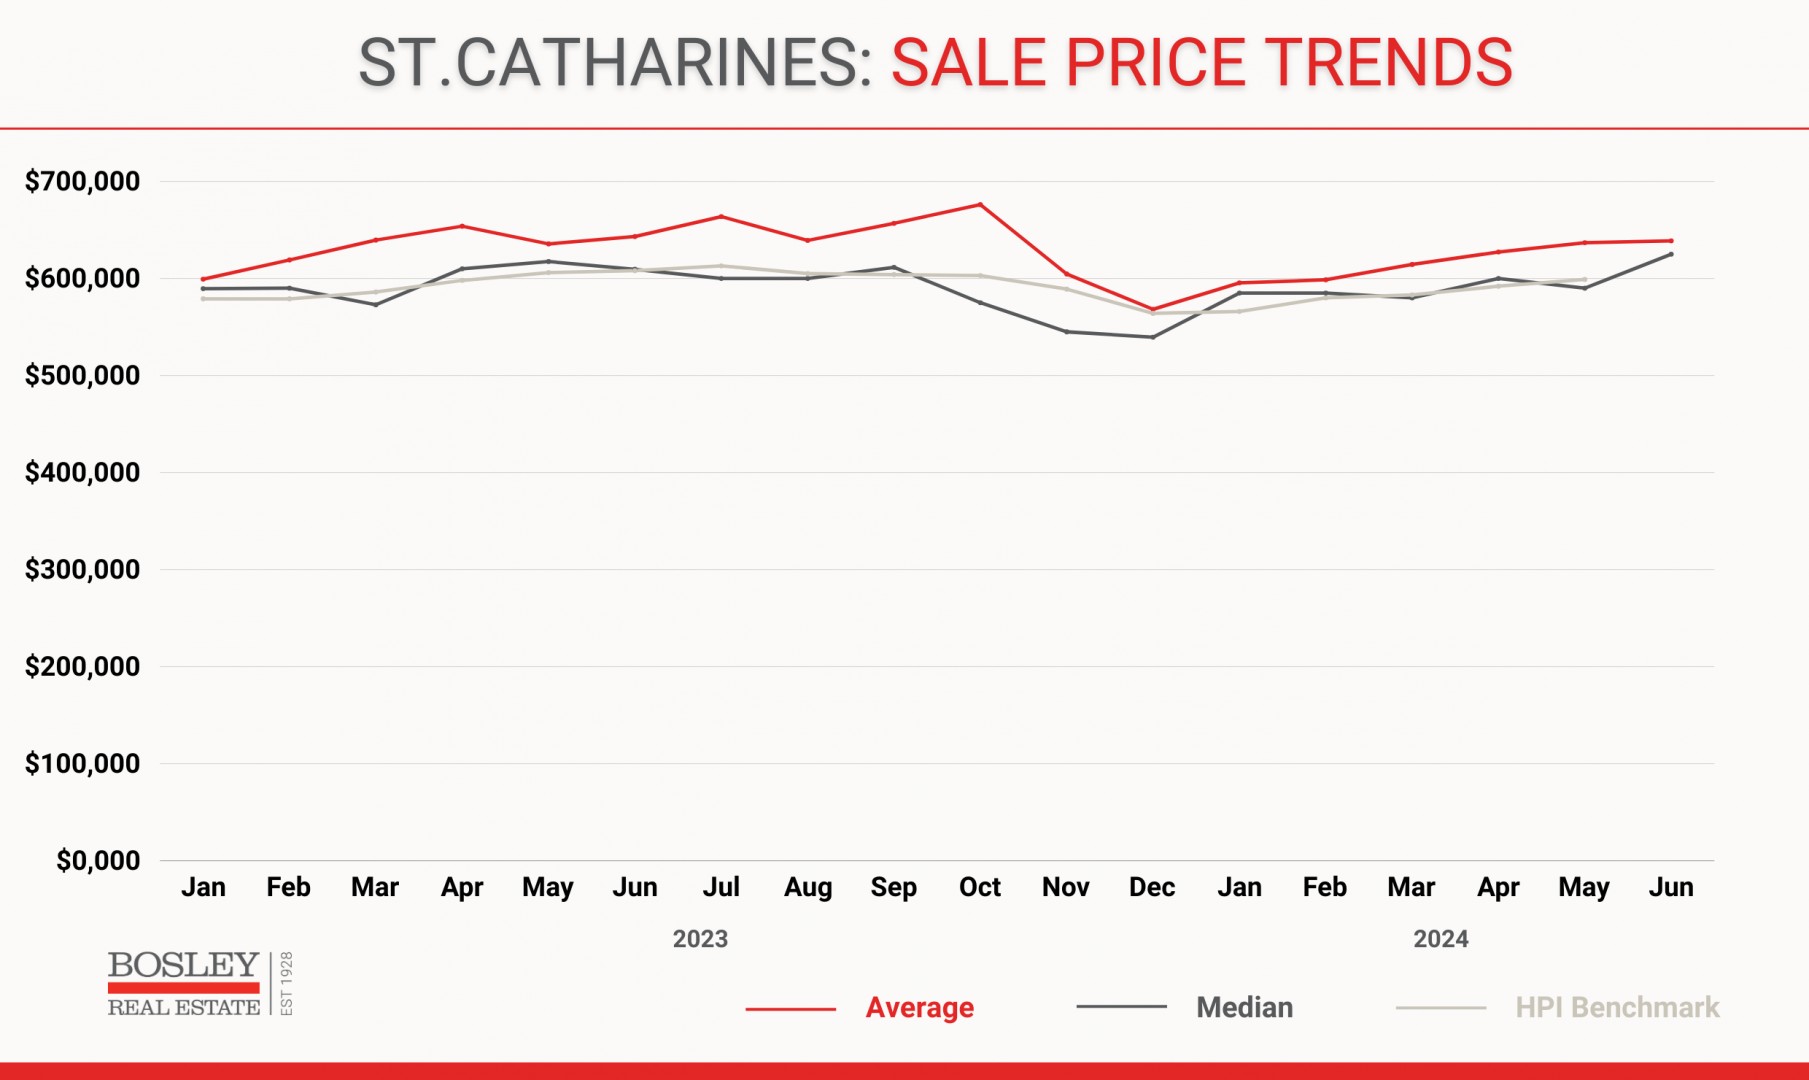
What are homes selling for?
This is often the info people are most curious to learn about. Below is a graph showing price movement over the past 24 months, with the Bank of Canada overnight rate changes noted as well. You'll see three lines in the graph below. Red is the average, dark grey is the HPI Benchmark and blue is the median. 2022 saw prices reced in direct relation to the BoC rate increases. After showing some resilience in early 2023, the BoC showed up again in June and July and delivered the final knock-out punch(es) which drove prices back down again. Here in early 2024, as noted above, we're pleased to see that resilience return yet again. Stay tuned!
Curious about St.Catharines?
St.Catharines has the highest annual sales of any city in Niagara, so we tend to track it more than most. And you guessed it. The overall trends fo St.Catharines refelct what we are seeing in Niagara and the Region in general.

St.Catharines home prices are showing strength too
And similar to the Niagara Region, we're pleased to see sale prices (Average, Median & HPI) all trending back in the right direction here in 2024.
Niagara Falls? Same story...
Well, sort of. Sales in Niagara Falls were sitting 35-48% below the 10-year average, so yes, 2023 was a year to forget. It is making progress here in 2024, but is sitll comfortably in double digits below where it should be in terms of monthly sales.
The balance of 2024 will be an interesting market to watch.
- what will the Bank of Canada do?
- will confidence improve?
- will some sellers throw in the towel and take their homes off the market?
- if prices are already showing improvement, what happens as a result of the above?
Stay in touch and check back often. We'll be here, keeping track of it all.
Looking for info related to your home or area?