The Niagara Real Estate Market Is Injured. For Now....
Have you ever seen a runner with a cramp? They may be walking while clutching their side, or slowly running with one arm extended in the air. They are still moving forward, but they’re not looking so comfortable.
That summarizes the Niagara real estate market as we approach the finish line of 2024. It is still moving, but it's consistently behind its regular pace.
UNCERTAINTY.
It is tough to make major life decisions at the best of times, let alone when uncertainty rules the day. Have a look at virtually any chart or graph from the last 5 years, and you'll see enough volatility to scare even the most hardened home buyer or seller away for the time being. However, there is one thing about volatility: eventually, it starts to ebb as the slightest hint of predictability starts to return.
As we approach the end of 2024, we aren't in a balanced or level market yet, but there are signs of trendslines getting more in range with what we might expect to see.
ASKING PRICES.
There are many reasons why a home is listed at a certain asking price. Sometimes the seller needs a certain price to buy what they're trying to buy, or they need a certain amount in order to simply be able to sell their home. Other times, the strategy is simply misguided, with the seller or agent getting their information from the wrong source. Either way, there are a considerable number of homes on the market that, at this point, seem to be detached from the reality of current pricing.
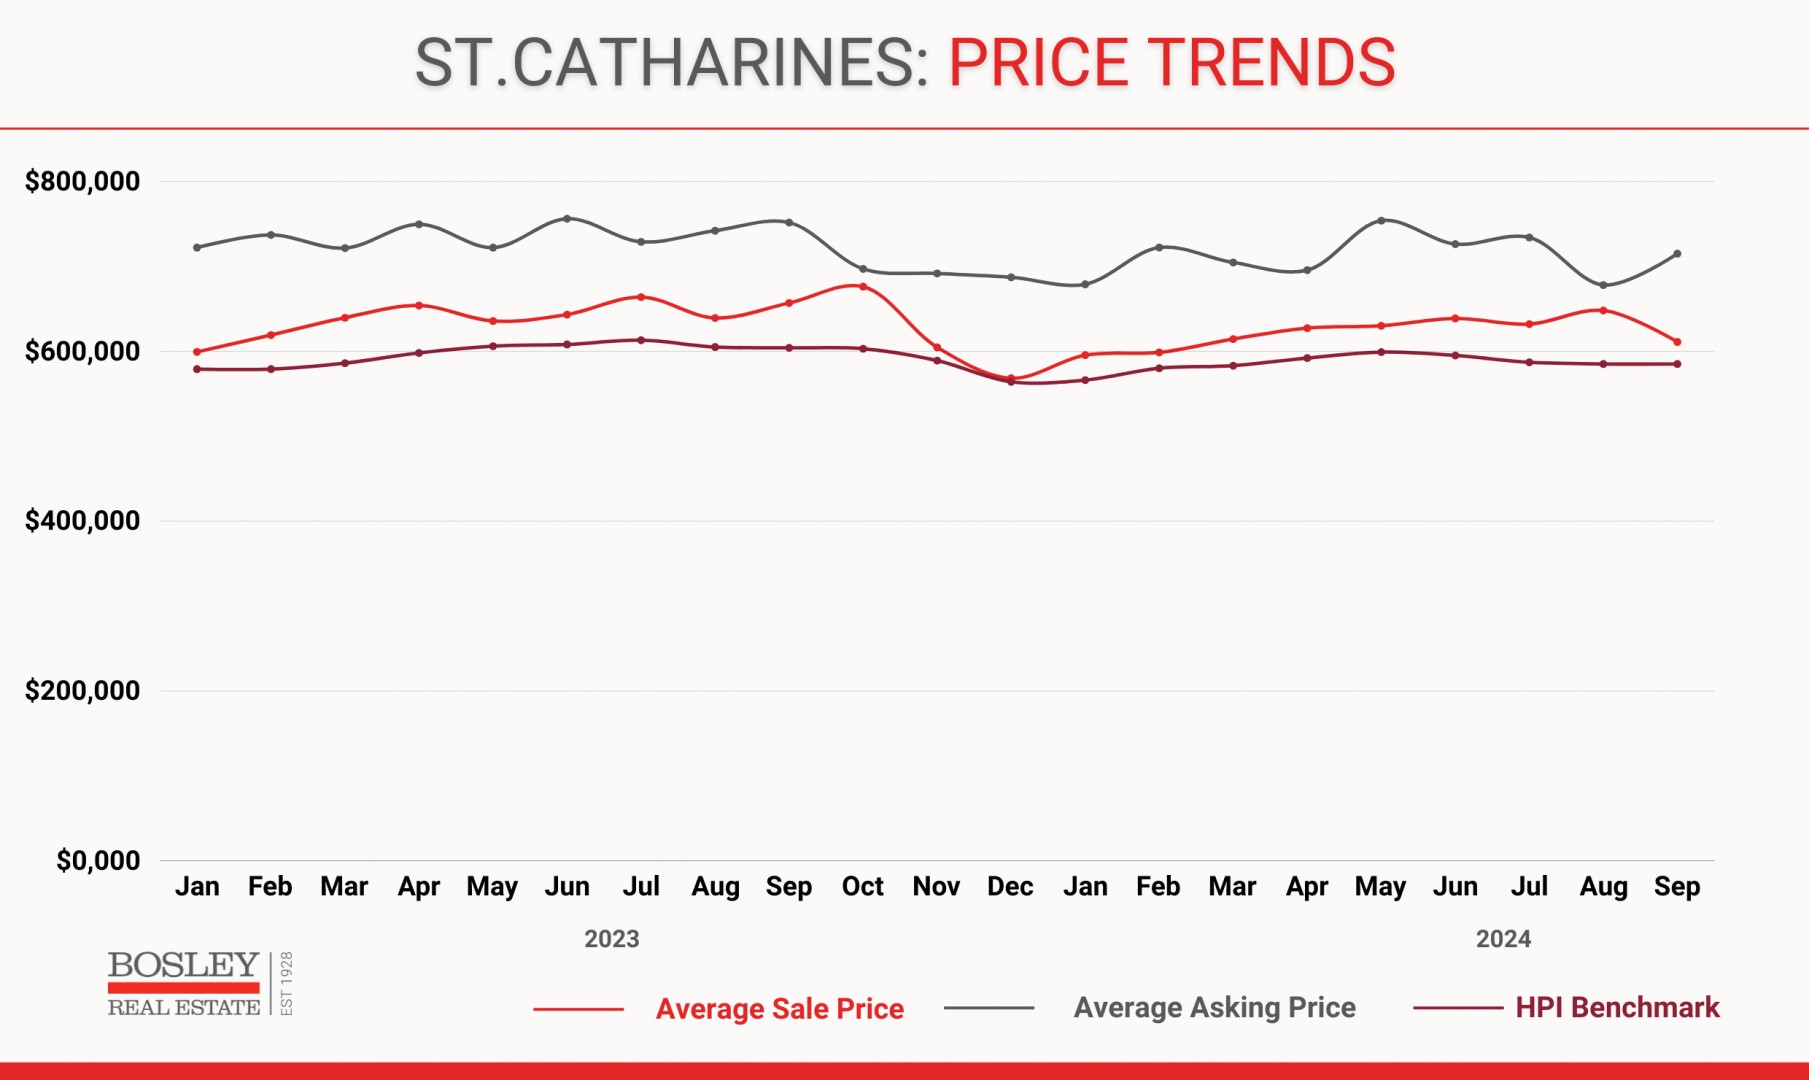
As an example, this graph shows the pricing trends for St.Catharines.
- The top line (dark grey) shows the average asking price.
- The middle line (red) shows the average sale price
- The bottom line (burgundy) shows the HPI benchmark. That is the typical home in any given market which removes outliers and sales that may not reflect the reality of a particular market.

It is important to note that there is (nearly) always a gap between the average asking and sale price. Where it becomes notable is the widening and narrowing of that gap. In a more fluid, healthy market, we'll see that gap narrow to sit in the $40-60,000 range, while in a slower market that is not running at full speed, the gap will widen to $100,000 or more.
Again, whether it is misinformation, stubbornness, or a simple financial need, there are a considerable number of homes that are priced too high. The end result of that is twofold:
- Record high active inventory.
- Record high days on the market.
We currently have both.
The positive aspect of that pricing chart? In spite of record-high active listing inventory coupled with sluggish sales, we still have a pricing trendline that is holding its own. More on that later...
SALES.
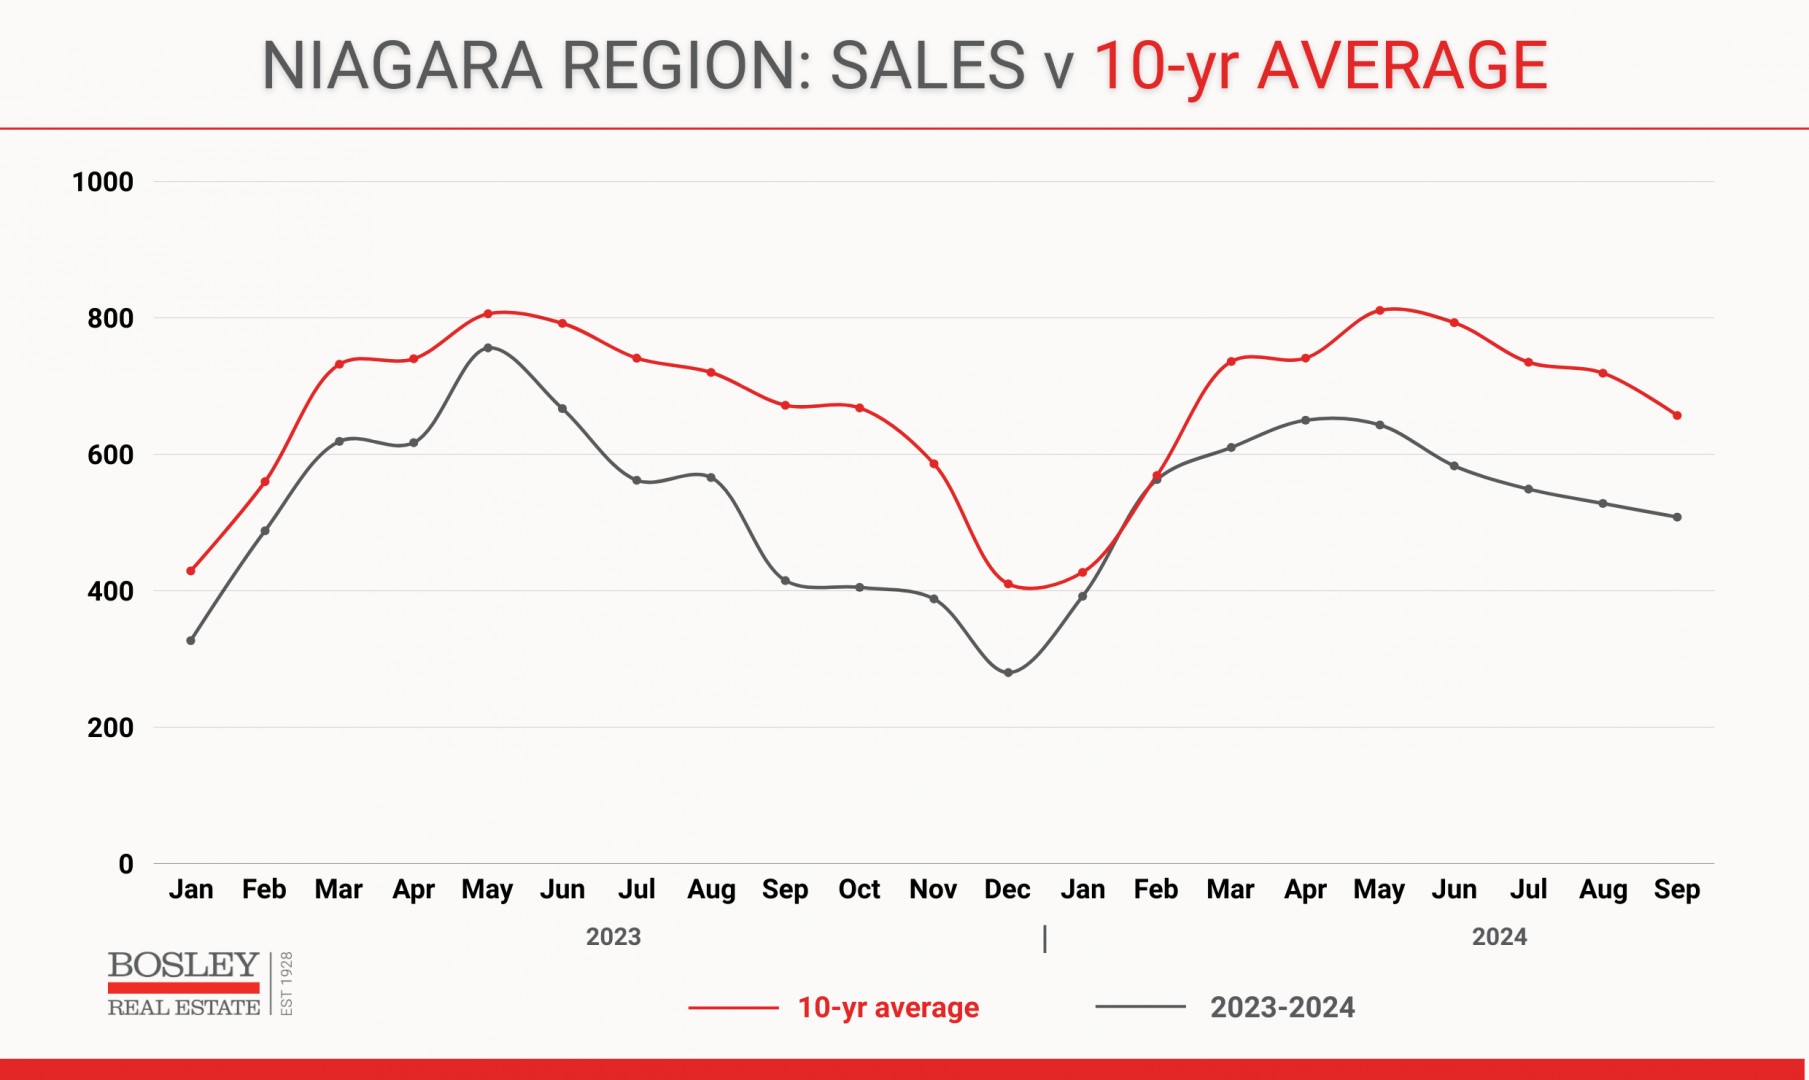
Normally, during the summer months and into September, the Niagara real estate market is running 700 to 800 sales per month. However, 2024 has been running 25% below those averages, with June through September stuck in the 500 to 600 range.
This graph shows the number of monthly sales in Niagara (in dark grey) compared to the 10-year average (in red). Note the early start to 2024, where sales were nearly at par with the 10-year average, before the reality of cautious market sentiment set in:

As we moved through the summer, sales settled in at 20 to 27% below the 10-year average. After August set an all-time record low (for the month of August) with 528 sales (the 10-year average for August is 719 sales), September showed some resilience, posting the best sales numbers (compared to the 10-year) since the spring market.
Yes, the leg of the market is still cramping, but there is a slight feeling that it is improving.
ST.CATHARINES
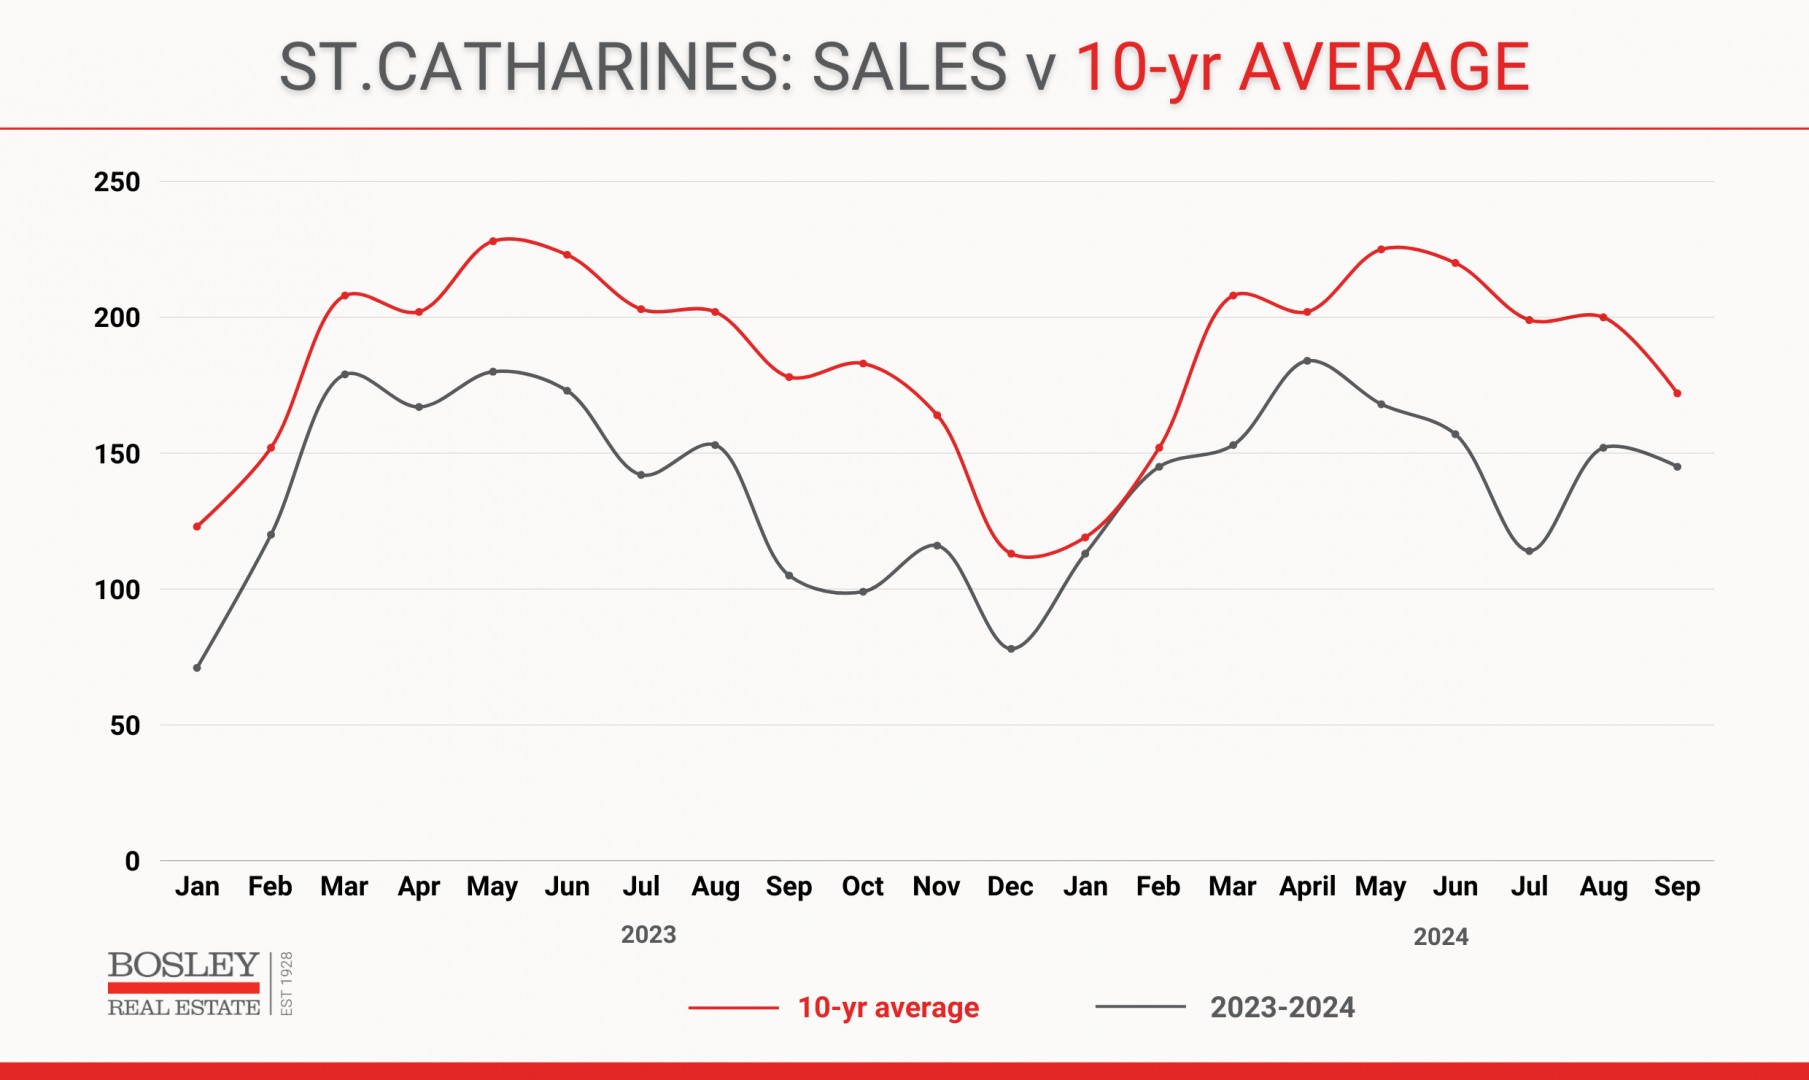
The largest city in Niagara in terms of number of sales is St.Catharines. As usual, St.Catharines echoed what happened region-wide, with a healthy pace to start the year getting sidetracked as the market shrugged off the June and July Bank of Canada interest rate cuts and posted fairly dreadful sales numbers.
How dreadful? Imagine that, after the Bank of Canada decreased the overnight by 0.25% in both June and July, sales would post their worst monthly totals for the year, with June down 28% and July down 43% compared to the 10-year average.
Here is the graphic evidence:

In a sign that the runner's cramp is easing, the trend of sales in St.Catharines compared to the 10-year average has improved monthly over the summer. The numbers compared to the 10-year:
- July: 113 sales (down 43%)
- August: 151 sales (down 25%)
- September: 145 sales (down 16%)
So, is the market running at full speed? No. Is it starting to show signs of feeling better? Yes.
WAITING ON THE BANK
Talking about the Bank of Canada and what they're going to do has become part of the conversation just about anywhere you go. Will they lower rates? Will my variable-rate mortgage finally return towards earth? Regardless, the fallout from the Bank of Canada's interest rate regime will still be felt well into 2025 and beyond.
In the world of real estate, those interest rates became everything. They were trouble for buyers, sellers, and everyone in between. The impact on market sentiment, buyer confidence, and their ability to buy was massive. The goal was to take the steam off of the real estate pot, among other things, and rest assured, it was mission accomplished.
But how did those rate changes impact home prices? Let's take a look.
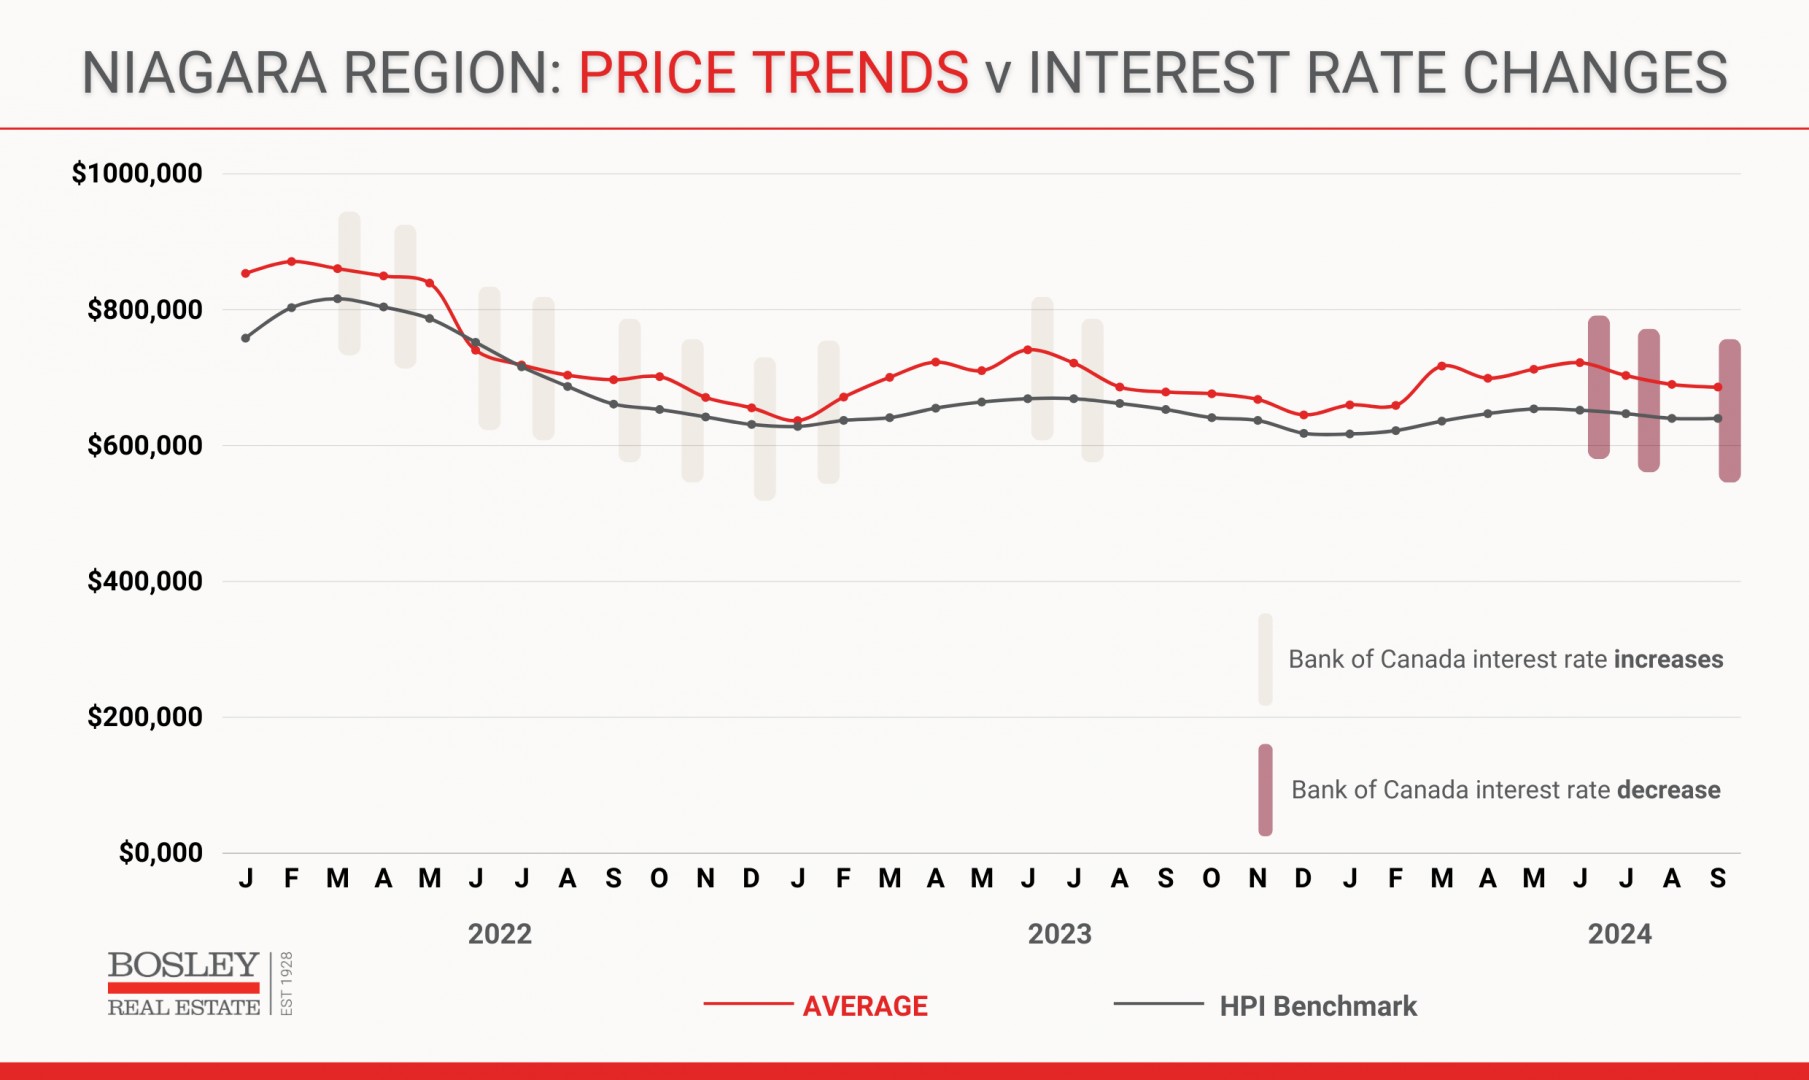
This chart goes back to January 2022. Seemingly a lifetime ago, early 2022 was a market unlike anything we had previously seen. It was a market that wasn't just running- its shoes were smoking as it set records upon records. Thankfully, that market mayhem was short-lived, as the Bank of Canada set a trip wire in the late spring and early summer.
In the graph below you'll see a few lines.
- The top line (red line) is the average sale price
- The bottom line (dark grey) is the HPI benchmark sale price
- The vertical dashes (light colour) are Bank of Canada interest rate increases
- The vertical dashes (light burgundy) are Bank of Canada interest rate decreases

It is fairly noteworthy that despite market conditions over the past 2 years, that sale prices have held their ground as well as they have.
Let's look at the big picture:
- Available inventory (homes for sale) at record high levels
- Sales running double digit percentage below the 10-year average for the past two years
- Days on Market for sales in the 70 to 90 days range
- Days on Market for active listings in the 90 to 110 days range
In spite of those daunting slices of data, the average sale price trend for Niagara has largely stabilized, with 2024 running in the $690,000 to $720,000 range for the past seven months.
WHAT HAPPENS NEXT?
Here is the question. Where do those trend lines go after the Bank of Canada brings rates down in October and December. Will they? That remains to be seen, but based on large scale economic data (inflation trend, jobs reports, overall performance of the economy), people far smarter than yours truly are calling for two more decreases in 2024.
If prices are holding as much as they are in spite of the current state of affairs out there, is it reasonable to expect a bump in the market as we cross the finish line of 2024, and run headfirst into 2025?
Only time will tell.
If you'd like to be kept in the loop, bookmark our BLOG page and come back often :)
Thank-you for reading.
If you'd like to have a confidential discussion about your home, the market or anything real estate related, please feel free to contact us here:
