

What exactly is going on out there?
If you’re confused with regards to the Niagara real estate market, rest assured you’re not alone. Depending on who you ask and where you look, the market is either great or asleep on its feet.
Which raises the first point.
Be careful when looking at generic, large-scale reports. Think about the weather. If you want to know what is happening today where you live, would you look at the report for the province? For that matter, southern Ontario or the Niagara Region as a whole wouldn’t make sense given the wild range in weather from Fort Erie to St.Catharines.
So, sure, consume those larger scale reports, but for your home, you probably need to be a bit more specific.
That being said, let’s have a look at the overall conditions for the Niagara Region.
Active Listings.
The number of homes for sale equates to the number of for sale signs you see while driving around the city. Currently, we have the highest number of monthly active listings since 2015. This graph tells the story well.
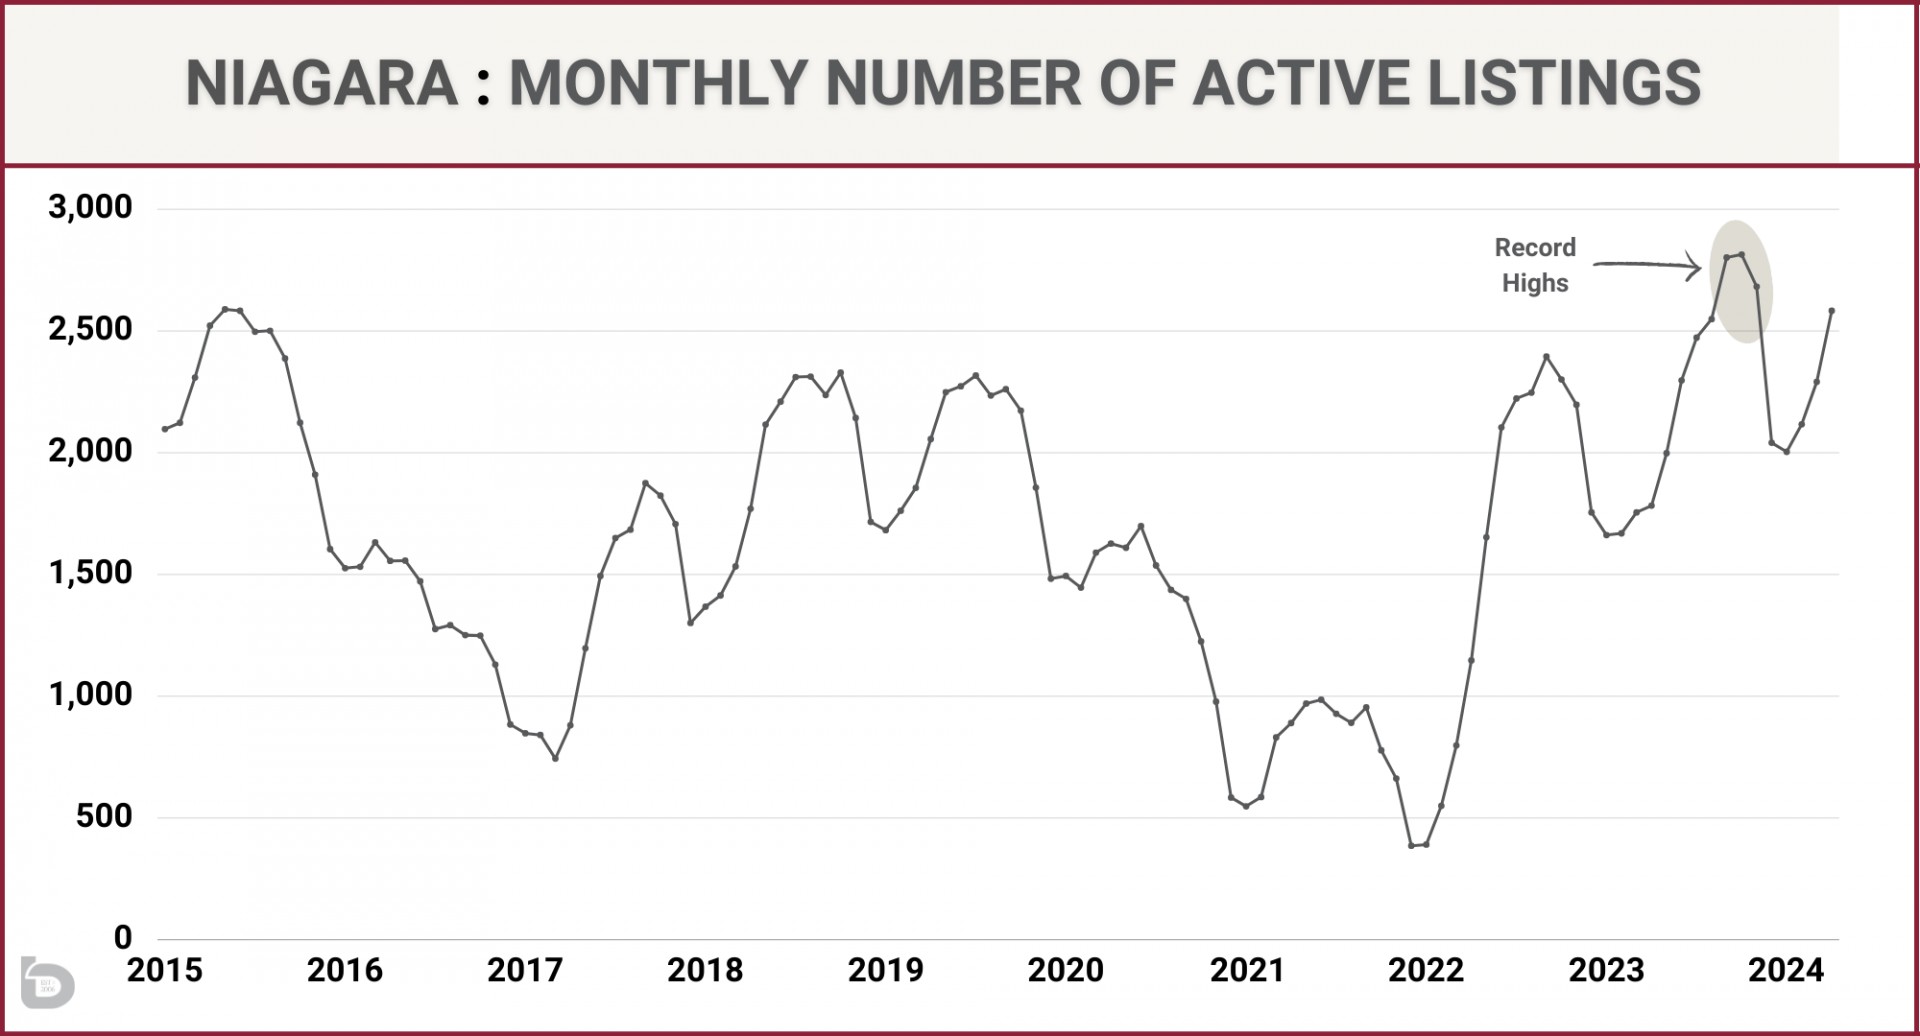
Long story short, the end of 2023 had the highest number of active listings of any month, over the past decade (and possibly earlier). Meanwhile, early 2024 has had the highest number for each respective month, going back to 2015.
Sidenote. April 2024 had 2,583 active listings while April 2021 had 890 active listings. It’s incredible how fast, and to what degree, things can change.
More supply = prices dropping right?
You’d think so, but it depends where you are looking. With supply at the level it is, buyers are in the position to shop and think before taking the plunge (imagine that). A buyer who has seen 20 homes has a pretty strong grasp on current values so when they see three homes, they’re able to assess value faster.
The result is the homes that are priced accurately are selling with less days on the market with a modest gain in prices (that includes average, median and benchmark prices).
Meanwhile, the overpriced active listings are sitting on the market.
Here is a look at home prices for both active asking prices and sale prices.
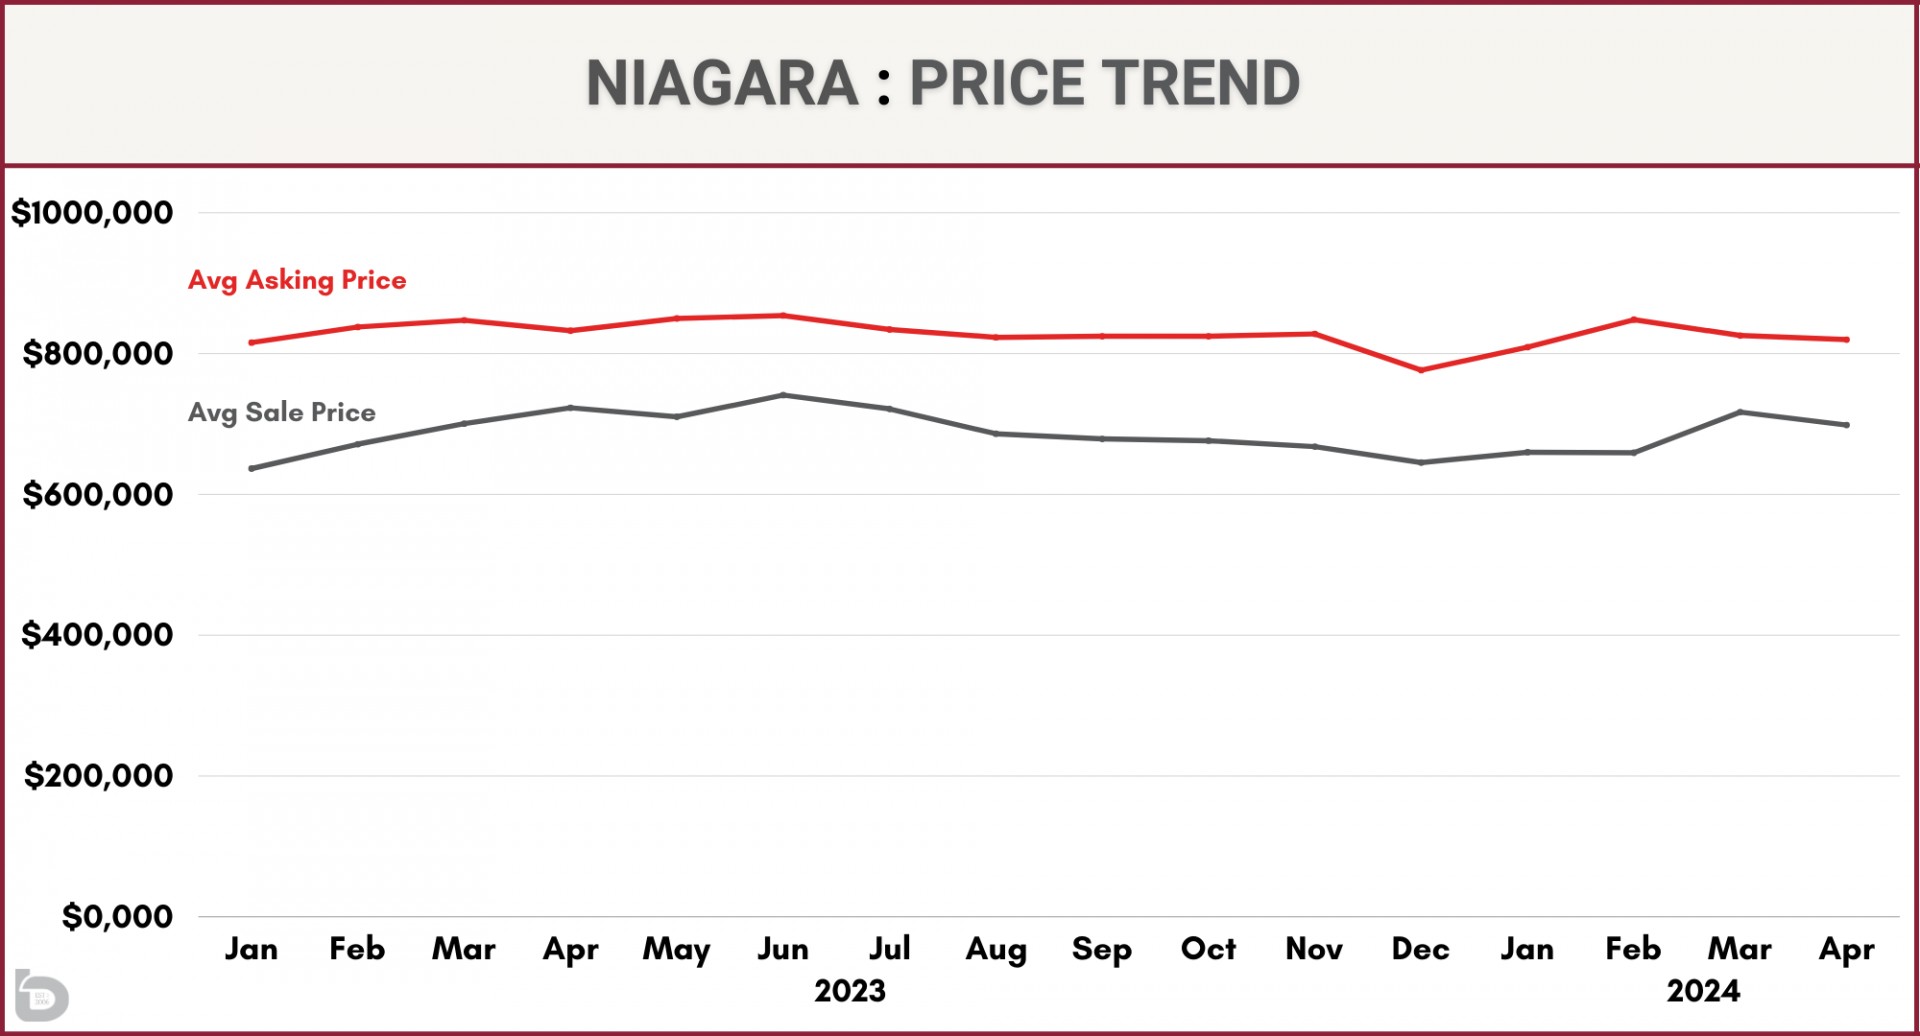
Some quick numbers. The average sale price in Niagara is up 6% since January. The average selling price for April came in at $698,500 while the average asking price was $820,000. Yes, there is a lot to unpack with averages, but when tracked over time, they shed some light on current conditions.

The gap between asking and sale prices will vary, depending on market conditions. To put the past 16 months in context, the average (monthly) gap between asking and sale prices for January 2023 – April 2024 was $141,000. The same period a year earlier, the gap was $108,000. On the other end of the spectrum was January 2021 to April 2022, where the gap was only $33,000.
Tracking that isn’t a perfect science, but the larger the gap, the more the market conditions tip in favour of the buyers while a small gap will indicate a seller’s market.
Keeping that in mind, here is the same data for St.Catharines.
The gap has average $94,000 over the past 16 months, with the trend tightening up so far in 2024, with April 2024 coming in at $74,830. That tightening is a symptom of the increasingly strong St.Catharines market.
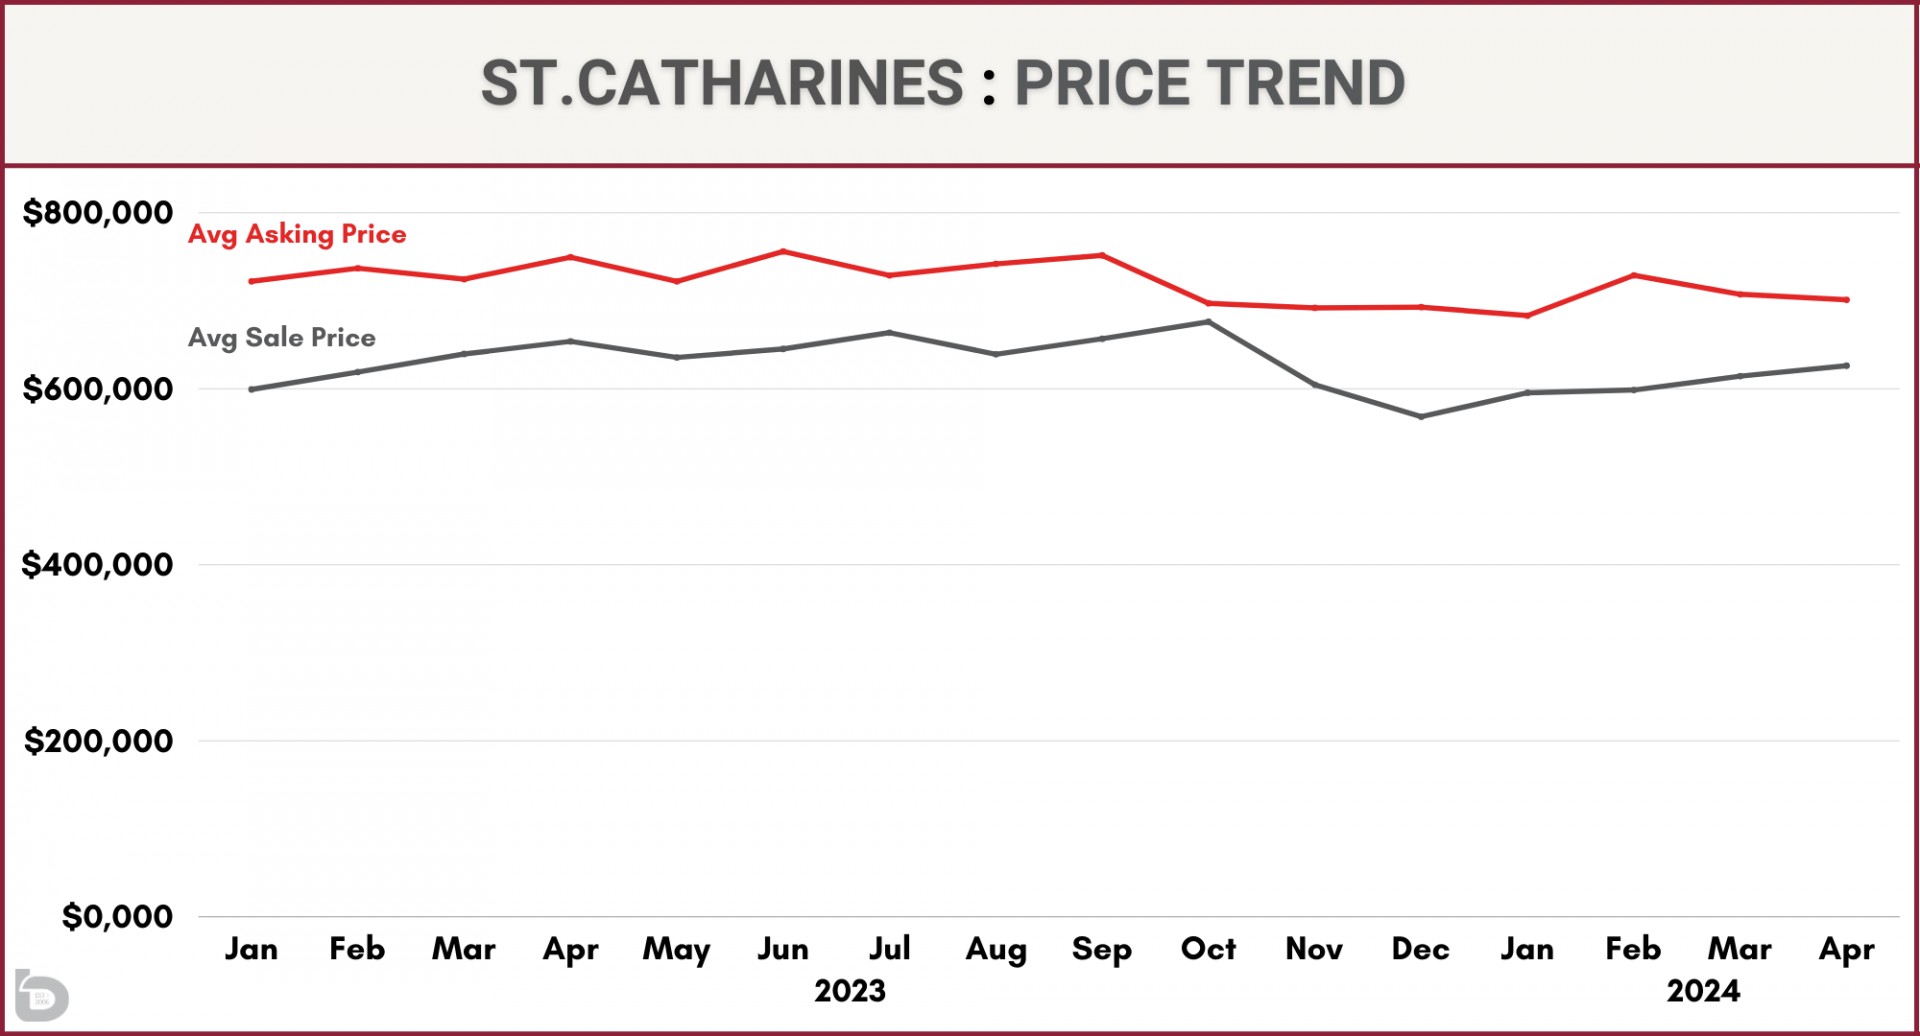
Another thing you can see in these price graphs is the downward pressure that was on prices towards the end of last year (post-interest rate hikes) while 2024 has shown some resilience so far.
How long does it take to sell a home?
Check out the roller coaster ride in the below chart. You’ll see the 16-month trend for 2023 and YTD 2024. Again, following the Bank of Canada interest rate increases of June and July (0.25% each month), supply jumped up while demand retreated. The result was a hike in monthly days on the market numbers. Note: Days on the Market figures represent time on the market for properties that sold.
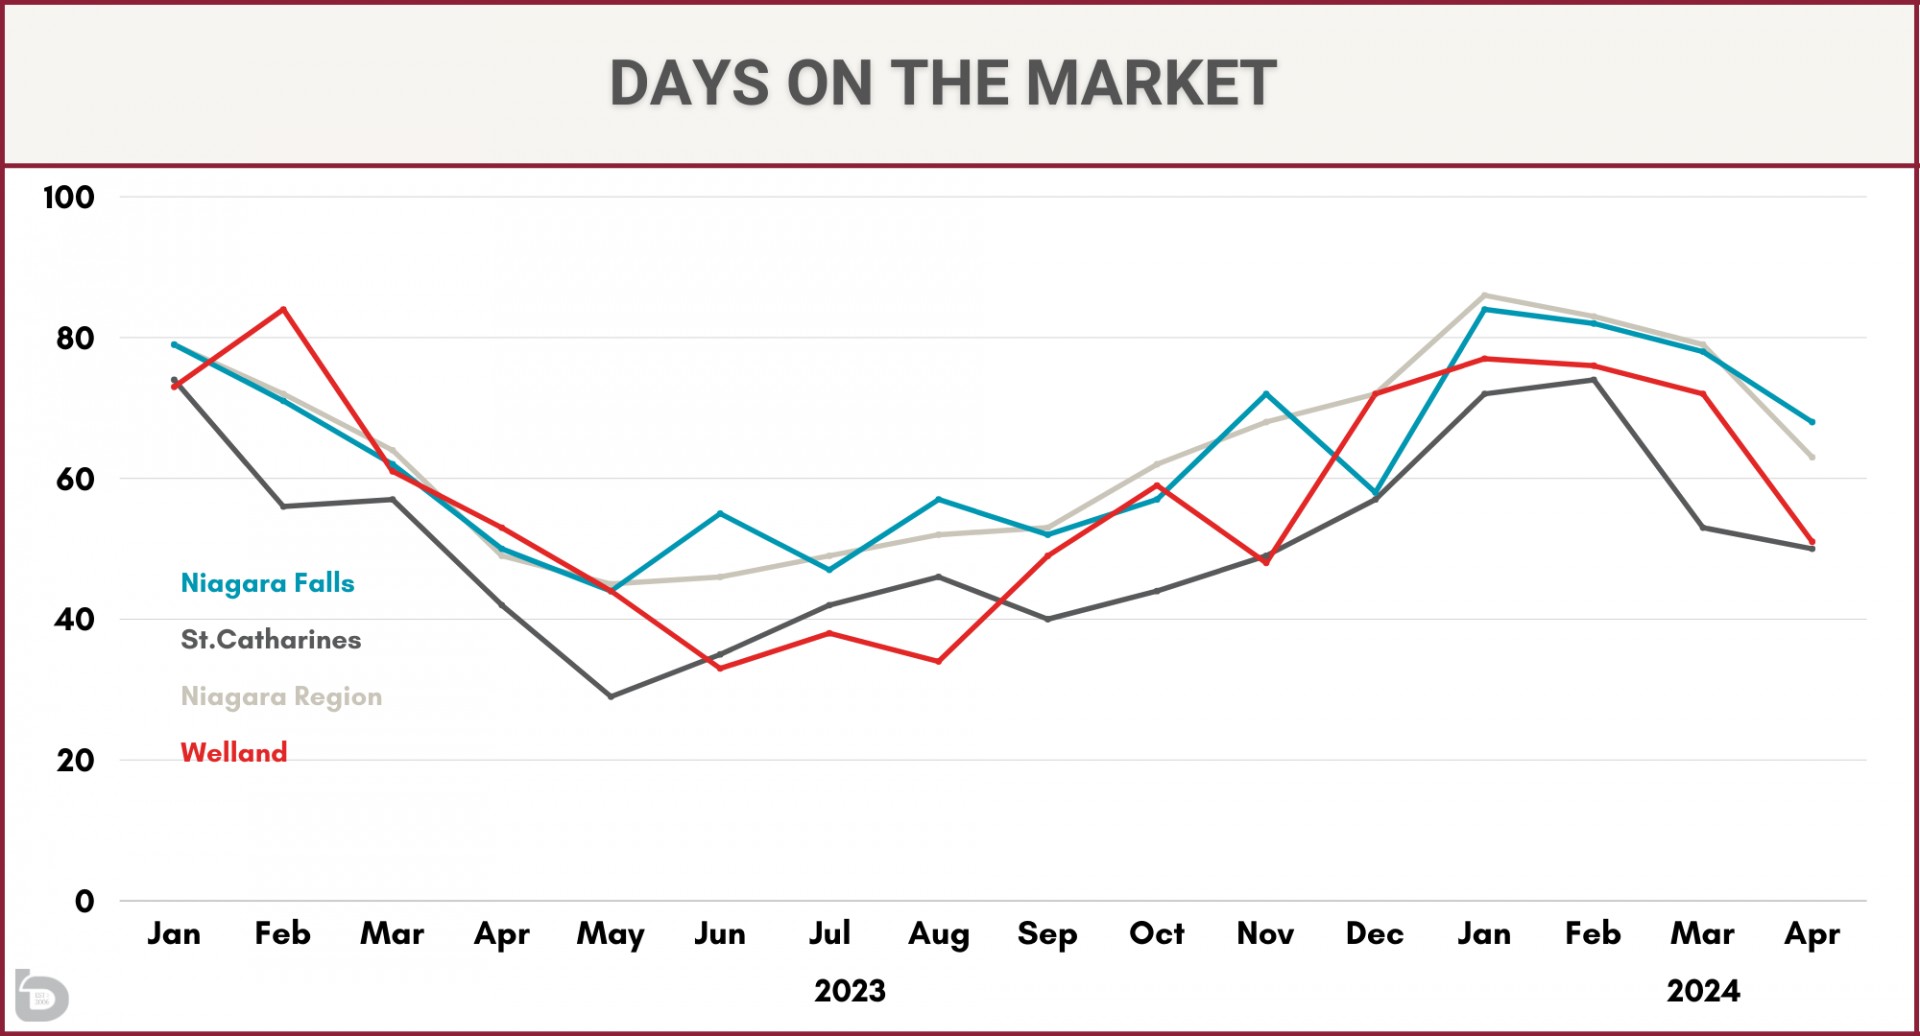
An example of the volatility: Days on market in the Niagara Region climbed from 29 days in May to 74 days in February.
Here in early 2024 however, we have seen a pleasant decrease in days on market for homes that are selling. This goes back to what was mentioned earlier. Buyers are seeing value in the homes that are priced accurately and snapping them up. That is shown in the monthly days on market numbers being 2 – 3 weeks faster in April than during the market low.
What do I do now?
Figuring out your strategy is always key, whether you are buying your first home or your ninth. And the same goes for those selling a home as well. So, if you're unsuwer where to get started, ask yourself these questions.
- Am I buying AND selling?
- Do I need to sell before I can buy?
- What are the market conditions for what I’m selling?
- What are the market conditions for what I’m buying?
- What can I reasonably expect in terms of competition for both my purchase and sale?
The answers to those 5 questions will direct your next steps. Yes, it is that simple and that complicated at the same time. We hope you found this info helpful.
If you are looking for more specific info, please do not hesitate to reach out.